Website Performance Metrics That Actually Impact Your Business
Mozilla shaved 2.2 seconds off their page load time and watched conversions jump 15.4%. Not 1%. Not 3%. Over fifteen percent.
Website Performance Metrics That Actually Impact Your Business
Mozilla shaved 2.2 seconds off their page load time and watched conversions jump 15.4%. Not 1%. Not 3%. Over fifteen percent. That single number changed how I think about website performance metrics forever, because it proved something I'd suspected for years: most teams obsess over the wrong numbers while ignoring the ones directly wired to revenue.
I've spent the better part of a decade helping teams diagnose why their sites bleed money, and the pattern is always the same. They're tracking dozens of metrics in dashboards nobody reads, while their actual users rage-quit on pages that take six seconds to become interactive. So here's my honest breakdown of which performance numbers deserve your attention, which ones are noise, and how to connect them to outcomes your CFO actually cares about.
The Three Numbers Google Cares About (And You Should Too)
Core Web Vitals aren't new, but they're still misunderstood. Too many teams treat them as an SEO checkbox rather than what they actually are: a proxy for real human frustration. Google's documentation spells out the specific thresholds your site needs to hit, and they're evaluated at the 75th percentile of real user sessions. That means your worst-performing visitors define your score, not your best ones.
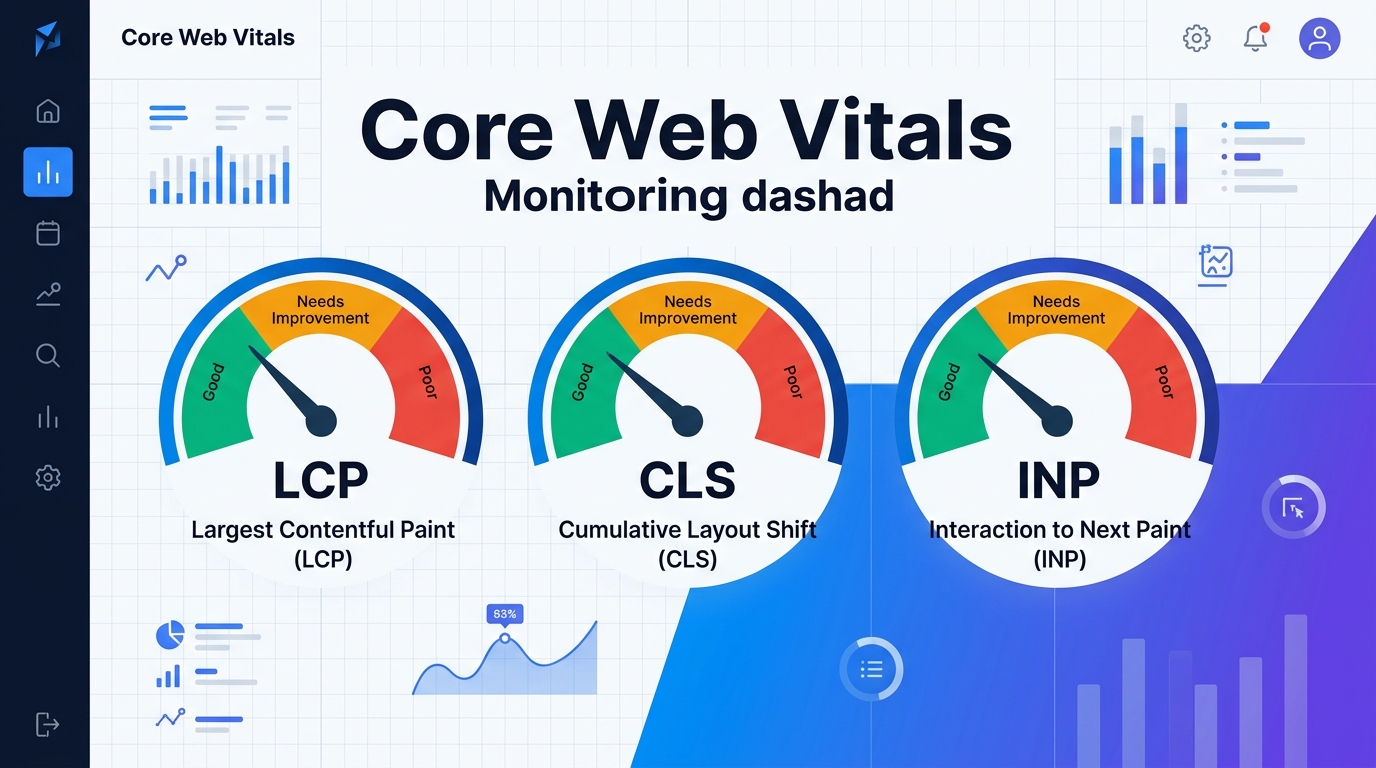
Here are the three metrics and their targets:
Largest Contentful Paint (LCP) measures how long it takes for the biggest visible element to render. Target: under 2.5 seconds. According to DebugBear's performance guide, this is the single best starting point when measuring site performance.
Interaction to Next Paint (INP) measures how quickly the page responds when someone clicks, taps, or types. Target: under 200 milliseconds. This replaced First Input Delay because FID only measured the first interaction, which was far too generous.
Cumulative Layout Shift (CLS) measures visual stability. Target: under 0.1. Every time a button jumps right as a user tries to tap it, that's CLS punishing your score.
Here's the uncomfortable truth: only about 48% of mobile sites pass all three tests. That means more than half the web is delivering a subpar experience, and if your competitors are in that failing majority, passing all three gives you a measurable edge in search rankings.
Why Page Speed Is a Revenue Problem, Not a Tech Problem
Let me put this bluntly: every conversation about page speed should start in a spreadsheet, not a terminal. The data connecting load times to money is staggering and well-documented.
Amazon found that every 100 milliseconds of added latency cost them 1% in sales. Walmart saw conversion rates climb 2% for every one second of improvement. A one-second delay can reduce conversions by up to 7%. For a business doing $10,000 a month in online revenue, that's $700 vanishing every thirty days because your hero image isn't optimized.
These aren't edge cases from giant retailers. The pattern scales down. I've seen a mid-size e-commerce site recover $14,000 in monthly revenue by compressing images, lazy-loading below-the-fold content, and switching to a CDN. The entire project took two weeks. If you're working on strategies to convert more of your existing traffic into revenue, fixing load times is the lowest-hanging fruit you'll find.
And this connects directly to bounce rates. When pages take longer than 3 seconds to load, bounce rates spike dramatically. We've written about what constitutes a healthy bounce rate, but the short version is: slow pages make every other metric look worse because users never stick around long enough to engage.
The Metrics That Matter vs. The Ones That Feel Good
Not all web analytics numbers deserve equal weight. I've sat in too many meetings where someone proudly reports that their Time to First Byte dropped by 40ms, while the actual user experience hasn't changed at all. Here's how I categorize site performance metrics by their real-world impact.
High Impact: Track These Weekly
LCP, INP, CLS (Core Web Vitals) — They influence rankings and directly reflect user experience.
Page load time — Keep it under 3 seconds. Period. As NitroPack's analysis notes, this benchmark is where user patience starts to break down.
Conversion rate by page speed segment — Slice your analytics by load time buckets. You'll almost certainly find that pages loading in under 2 seconds convert at 2-3x the rate of pages taking 4+ seconds.
Scroll depth — Contentsquare's research recommends comparing scroll depth across desktop and mobile separately, since the behavior patterns differ significantly. If mobile users consistently stop scrolling at the 30% mark, something above that line is broken.
Medium Impact: Check Monthly
Time to First Byte (TTFB) — Useful for diagnosing server-side issues, but it's an upstream metric. Fixing TTFB alone won't fix a bad user experience if your frontend is bloated.
Total Blocking Time (TBT) — This is a lab-based metric related to interactivity that correlates well with INP. Great for debugging, less useful for executive reporting.
Error rates (4xx and 5xx) — A spike here means broken links or server failures. Important but usually obvious.
Low Impact: Stop Obsessing
Fully loaded time — Users don't wait for every last tracking pixel to fire. What matters is perceived load time.
Number of HTTP requests — This was critical in the HTTP/1.1 era. With HTTP/2 and HTTP/3 multiplexing, raw request count matters far less than payload size.
Vanity uptime numbers — Yes, you want high availability. But obsessing over 99.999% vs 99.99% uptime is irrelevant if your pages take 6 seconds to render when they are up.
How to Set Up Performance Monitoring That Actually Works
Here's where most teams go wrong with performance monitoring: they install a tool, look at the dashboard once, and never build a process around it. Data without action is just decoration.
I recommend a two-layer approach.
Layer 1: Lab Data for Debugging
Lab tools like Lighthouse, GTmetrix, and WebPageTest run your pages in controlled conditions. They're fantastic for identifying specific problems: that uncompressed JavaScript bundle, the render-blocking CSS file, the image served as a 4MB PNG when it should be WebP. Use these when you're actively fixing things.
But lab data has a blind spot. It doesn't reflect what real users experience across different devices, network speeds, and geographies. A page that loads in 1.8 seconds on your MacBook Pro over fiber might take 7 seconds on a three-year-old Android phone over 4G in a rural area.
Layer 2: Field Data for Reality
Google Search Console and the Chrome User Experience Report (CrUX) show you how your pages actually perform for real visitors. This is the data Google uses in its ranking algorithm, so it's the data you should prioritize.
PageSpeed Insights bridges both worlds by showing lab results alongside field data, and I'd recommend running it against your top 10 landing pages at least monthly. The Chrome team has published their best practices for improving Core Web Vitals, and those recommendations are grounded in patterns they've observed across millions of sites.
If you've noticed your search rankings slipping and can't figure out why, poor Core Web Vitals scores are one of the most overlooked causes of ranking drops. Google doesn't penalize slow sites with a dramatic plunge, but it steadily advantages faster competitors, which looks like a slow decline on your end.
The Fixes That Give You the Biggest Return
I'm not going to pretend this is an exhaustive optimization guide, but here are the five changes I've seen produce the most dramatic improvements in site performance, ranked by effort-to-impact ratio:
Serve images in WebP or AVIF format with explicit width and height attributes. This alone can cut LCP by 30-50% and eliminate the most common cause of layout shift.
Defer non-critical JavaScript. Every third-party chat widget, analytics tag, and social embed competes with your core content for processing power. Defer or lazy-load anything below the fold.
Use a CDN. If your audience spans multiple regions and you're serving everything from a single origin, you're adding hundreds of milliseconds of latency for no reason.
Preload your critical fonts and set font-display to swap. This prevents the invisible text flash that kills both CLS and perceived load time.
Enable browser caching with aggressive cache headers. Returning visitors should load in under a second. If they don't, you're re-serving assets they already have.
These five changes, applied to a typical WordPress or Shopify site, can move your Core Web Vitals from failing to passing in a single sprint. That's not theory. I've done it multiple times.
Connecting Performance to the Metrics Your Team Reports
The gap between engineering and marketing on performance is wider than it should be. Engineers talk about TTFB and bundle sizes. Marketers talk about conversions and bounce rates. Neither realizes they're describing the same problem from different angles.
Here's the bridge: performance data should flow into your marketing data quality practices. If your analytics platform isn't segmenting conversion data by page speed, you're missing the single biggest explanatory variable for why some pages convert and others don't.
Create a simple report that maps your top 20 pages by:
Average LCP
Conversion rate
Bounce rate
Revenue (if applicable)
Sort by LCP. I guarantee you'll see a near-linear relationship between load time and business outcomes. That report becomes your performance improvement roadmap, prioritized by dollar impact rather than technical severity.
And if you're rethinking your broader SEO approach alongside AI-driven search changes, know that performance is one of the few ranking signals that hasn't gotten murkier. Google has been explicit about what they want: LCP under 2.5, INP under 200ms, CLS under 0.1. No interpretation needed.
Your One Actionable Step This Week
Open PageSpeed Insights. Test your five highest-traffic pages. Write down the LCP, INP, and CLS scores for each. Then rank them by business value: which page generates the most leads or revenue? Fix the highest-value, worst-performing page first. Don't try to boil the ocean. One page, fixed well, will teach you more about your site's performance patterns than any dashboard ever will.

Sarah Chen
SEO strategist and web analytics expert with over 10 years of experience helping businesses improve their organic search visibility. Sarah covers keyword tracking, site audits, and data-driven growth strategies.
Explore more topics