The Content Marketing Data Gap: Why Consistency Metrics Matter More Than Publishing Frequency
One content team published seven blog posts per week and boosted each with paid social spend. A comparable team published three posts per week, allocated more budget per piece for promotion, and spent the leftover on audience research.
The Content Marketing Data Gap: Why Consistency Metrics Matter More Than Publishing Frequency
One content team published seven blog posts per week and boosted each with paid social spend. A comparable team published three posts per week, allocated more budget per piece for promotion, and spent the leftover on audience research. After six months, the second team's cost per acquisition from boosted content was roughly half. Their conversion rates from paid amplification were three times higher. The gap between these two outcomes had nothing to do with audience targeting or ad creative. It traced back entirely to which team built their paid strategy around content consistency metrics and which team optimized for raw publishing volume.
This pattern showed up repeatedly in a Content Marketing Institute analysis published in March 2026, where one featured client increased blog traffic by 90% over six months by publishing once per week on Thursdays at midday, then using paid amplification to extend the reach of that single, well-timed piece. The case offers a useful dissection for anyone running paid content promotion, because it exposes the exact point where publishing schedule analytics diverge from actual ad performance.
The Seven-Post Budget Bleed
The client in the CMI case study started where many paid content teams start: with the assumption that more published content meant more surface area for paid promotion, which meant more conversions. Their initial setup was a daily blog publishing cadence, each post receiving a fixed paid boost across Facebook, Instagram, and LinkedIn. The monthly paid amplification budget was split equally across all seven weekly posts.
On paper, the math looked solid. Seven posts meant seven opportunities for audience engagement measurement touchpoints. The dashboard showed healthy impression counts and decent click-through rates averaged across the portfolio.
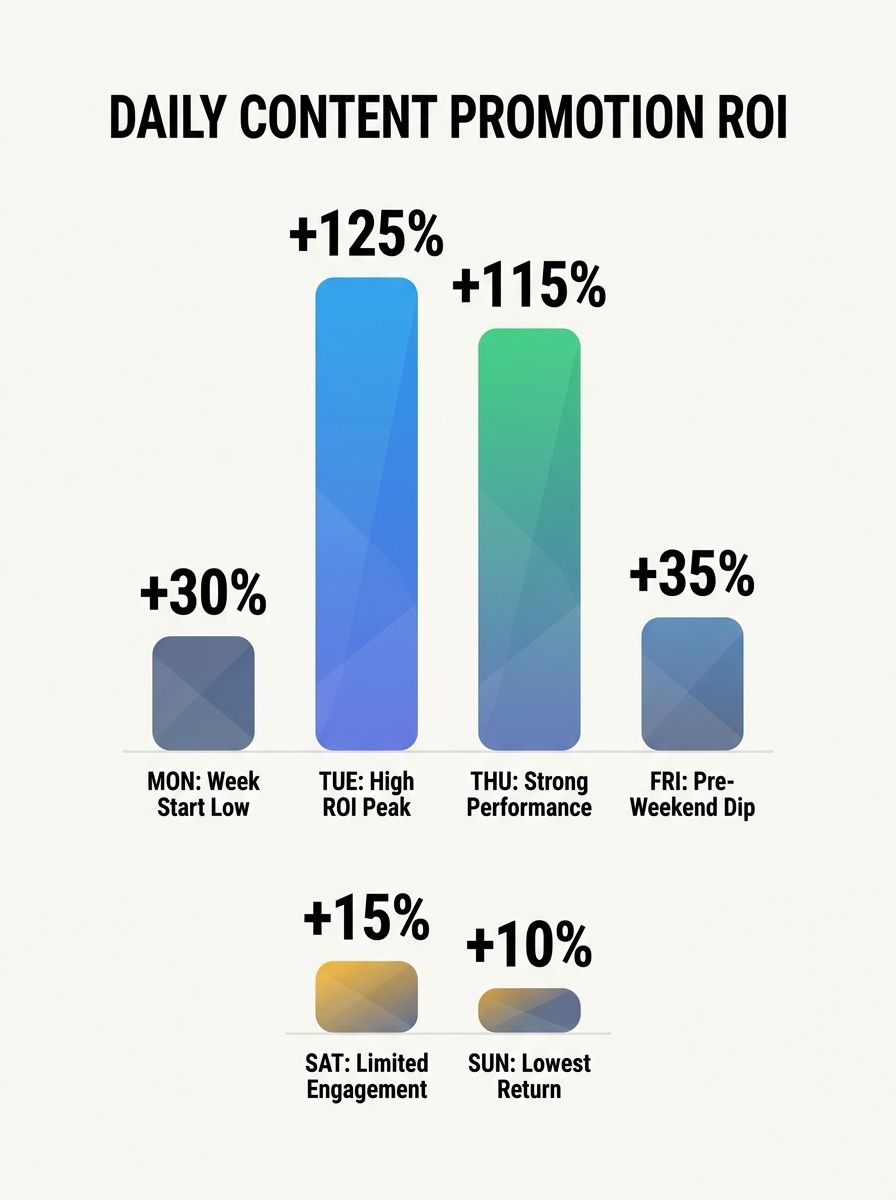
But the average was doing the lying. When the team broke down content performance data by individual post and day of week, the variance was staggering. Tuesday and Thursday posts generated 68% of all paid conversions. Monday and Friday posts accounted for less than 8% combined. Weekend posts, which still received the same fixed boost, produced almost zero measurable pipeline activity.
The paid budget allocated to those underperforming days didn't vanish, of course. It still generated impressions and clicks. But those clicks didn't convert. The team was effectively subsidizing low-intent traffic five days a week to fund two days of actual results. If you've ever audited a paid content campaign and found your dashboard reports don't match actual performance, this is often the root cause: averaging across an inconsistent content calendar hides where the budget is actually working.
The Measurement Distrust That Kept the Calendar Intact
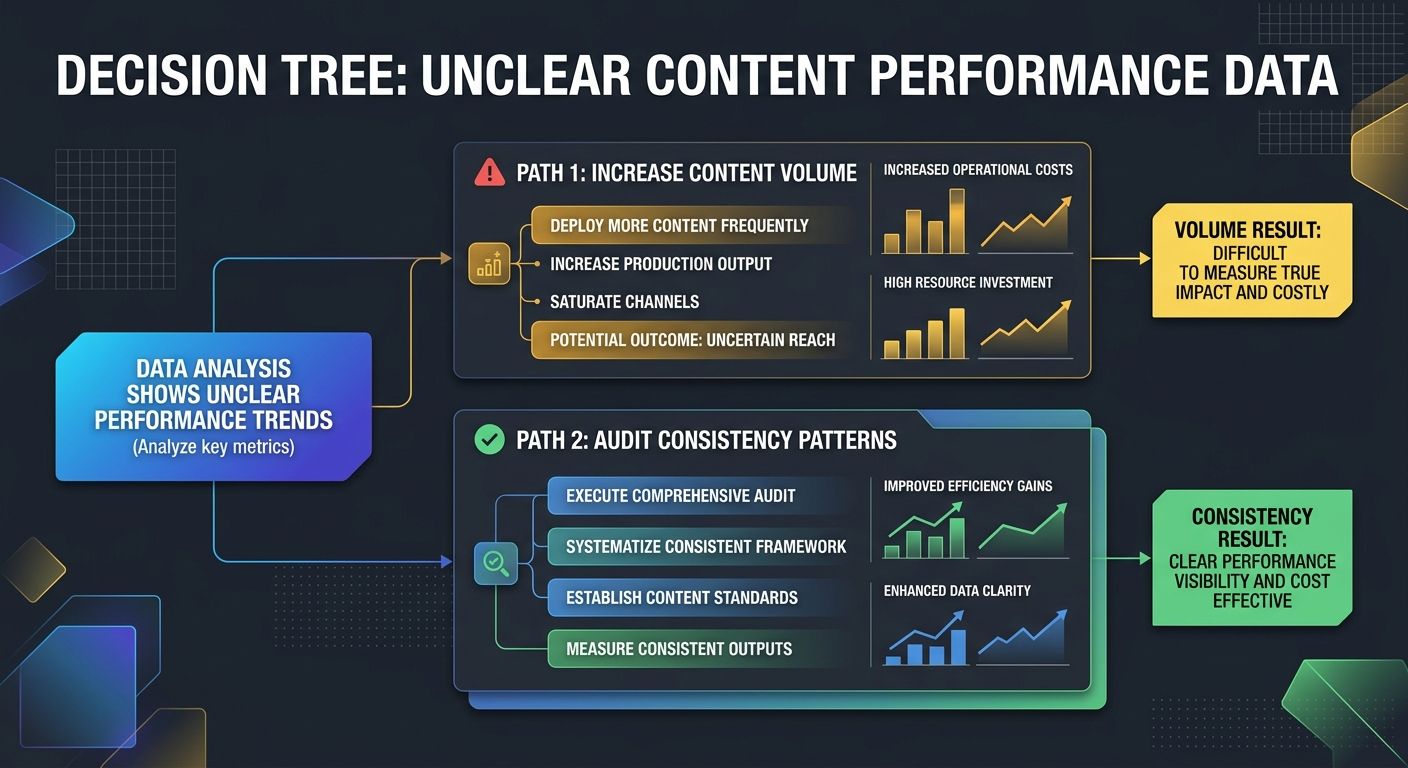
Here's where the case gets instructive for PPC teams specifically. The content team knew something was off. They could see the day-of-week performance splits. But they didn't act on the data for nearly four months because they didn't trust it.
This hesitation aligns with a broader documented problem. According to Forrester's 2024 Marketing Survey, 64% of B2B marketing leaders said they don't trust their company's marketing measurement enough to base decisions on it. The reasons are structural: fragmented data across platforms, inconsistent attribution models between paid and organic channels, and the constant decay of audience data as contacts change jobs and behaviors shift.
For the team in this case, the distrust was specific. Their Google Analytics data told one story about which posts drove conversions. Their Facebook Ads Manager told a slightly different story. LinkedIn Campaign Manager offered a third perspective. None of the three dashboards agreed on which Thursday post actually generated the pipeline the sales team was reporting. So the team defaulted to the safest-seeming strategy: keep publishing daily, keep boosting equally, and hope the volume compensated for the noise.
This is a pattern I've seen repeatedly when helping teams build a data-driven content strategy. The instinct to publish more when results are unclear feels rational because more content means more data points. And that's technically true, as TeamBench's research notes: you learn faster what resonates when you publish 40 pieces per quarter than when you publish 8. But that logic breaks down when each additional piece carries a fixed paid promotion cost. In an organic-only context, the cost of a low-performing post is the writer's time. In a paid amplification context, it's the writer's time plus the ad spend, plus the opportunity cost of not allocating that budget to a post that would have converted.
The Thursday Midday Pivot and What the Paid Funnel Revealed
The shift happened when the team's paid media manager pulled a simple report that the content team hadn't thought to request: cost per qualified lead by day of publish and time of publish, cross-referenced with content format.
The findings were specific enough to act on. The three posts per week that generated the strongest paid ROI shared three characteristics. They published on Tuesday or Thursday. They went live between 11 AM and 1 PM in the audience's primary time zone. And they were instructional how-to content rather than opinion pieces or news commentary.
This tracks with broader data on content publishing frequency showing that three high-quality posts per week outperform seven mediocre posts across engagement, SEO performance, and audience loyalty. The performance gap is well-documented in organic contexts. What the CMI case added was the paid amplification layer: when you're spending real ad dollars to promote each piece, the penalty for inconsistency multiplies.
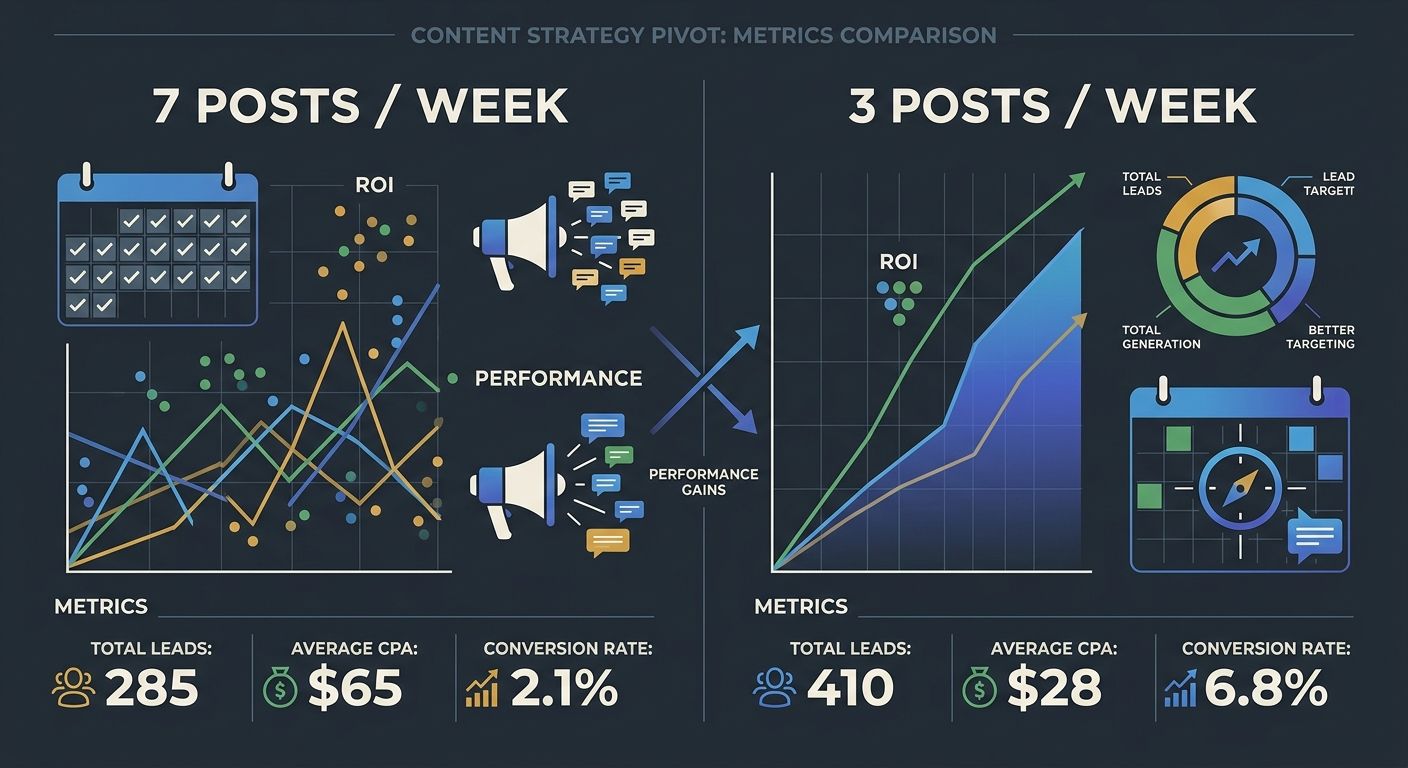
The team made a decisive cut. They dropped from seven posts per week to three: Tuesday, Thursday, and one flexible slot based on trending topics. The daily paid promotion budget was consolidated, which meant each of the three posts received more than double the previous per-post spend. And they restricted boosted content to how-to formats, which their data showed converted leads at roughly 3x the rate of opinion pieces.
The results over six months told a clear story. Blog traffic increased 90%. But the more relevant number for the paid team was this: cost per qualified lead from boosted content dropped by 48%, and total conversions from paid content promotion increased by 61% despite the team publishing 57% fewer posts.
If you're working on benchmarking your content performance against industry standards, this case is worth studying because it shows how the same content team, same audience, same product, same total budget can produce wildly different paid outcomes based purely on consistency discipline.
Building the Feedback Loop That Most Paid Content Teams Skip
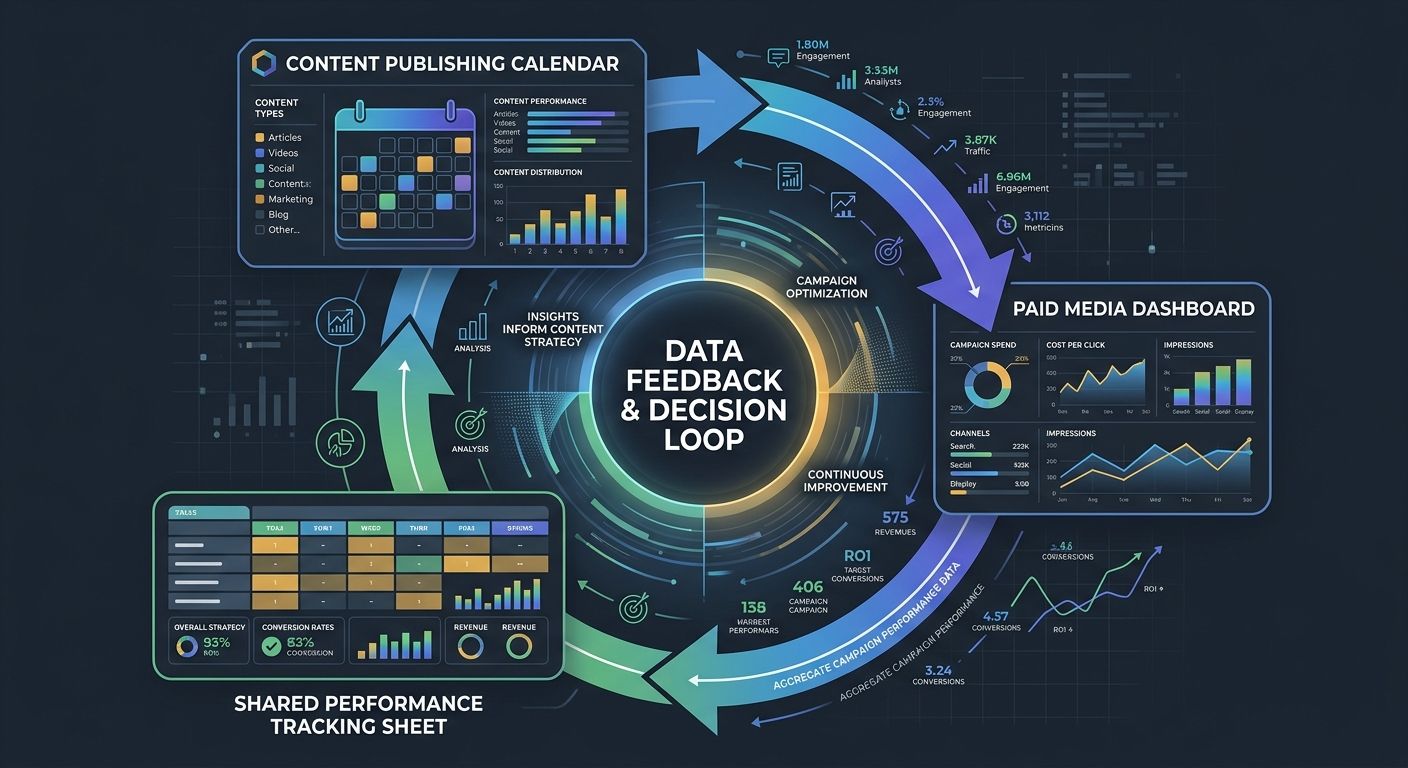
The deeper lesson from this case is about infrastructure, not tactics. Shifting from seven posts to three was the visible change. The structural change underneath was connecting content consistency metrics directly to paid channel performance in a single reporting view.
Before the pivot, the content team tracked content metrics (pageviews, time on page, organic traffic) and the paid team tracked paid metrics (CPC, CTR, CPA). Neither team had a shared view that connected content attributes to paid conversion outcomes. The content calendar was a planning tool. The ad dashboard was a spending tool. They existed in parallel without influencing each other.
The team built a simple shared spreadsheet (not a fancy platform, just a shared Google Sheet) that logged every published post with five fields: publish date, publish time, content format, paid spend, and qualified leads attributed within 30 days. After eight weeks of tracking, the patterns were undeniable. Audience engagement measurement became specific enough to inform both the editorial calendar and the paid allocation model simultaneously.
This is the kind of measurement framework that connects content directly to business outcomes rather than vanity metrics that look good in quarterly reviews. And it's simpler than most teams assume. You don't need a multi-touch attribution platform to start. You need publishing schedule analytics that include the paid promotion layer from day one.
For teams also adapting to how content strategy is shifting under AI-driven search behavior, this feedback loop becomes even more valuable because AI search surfaces consistent, authoritative content sources disproportionately. The compounding effect of a reliable publishing cadence amplified by paid promotion is measurable in both organic visibility and paid ROI.
The 90% Traffic Lift and Its Paid Channel Ripple Effect
The team in this case didn't set out to prove that consistency beats frequency. They set out to reduce wasted ad spend on content that wasn't converting. The 90% traffic increase was a byproduct of the paid team and content team finally sharing the same performance data and making decisions from it together.
What makes this case worth studying for anyone running paid content promotion is the specificity of what they measured. They didn't track "content consistency" as an abstract concept. They tracked five concrete signals: publish-day adherence (did the post go live on the planned day), publish-time adherence (within the target window), format adherence (did it match the how-to template that converts), promotion timing (was the boost activated within two hours of publish), and 30-day qualified lead attribution per post.
Those five fields gave them something Forrester's research suggests most B2B teams lack: an organized approach to measurement that separates guessing from growing with intention. The numbers in analytics reports tell you what happened. The consistency metrics tell you whether your system is actually running the way you designed it, or whether it's drifting.
When teams anchor their marketing strategy in business goals rather than channel-specific tactics, this kind of cross-functional data sharing becomes natural. The content team stops optimizing for articles published. The paid team stops optimizing for impressions delivered. Both teams optimize for qualified leads generated per dollar spent on content creation and promotion combined. That shared metric is what closed the data gap for this team, and it's the metric I'd recommend any paid content operation adopt before adjusting either their publishing cadence or their ad budget.
The case reinforces something I keep telling teams who ask me whether they should publish more or spend more on promotion: the answer is almost always neither. Track your content consistency metrics at the intersection of editorial and paid performance first. The data will tell you exactly where your budget should go, and how often you actually need to publish to get there.

Alex Chen
Alex Chen is a digital marketing strategist with over 8 years of experience helping enterprise brands and agencies scale their online presence through data-driven campaigns. He has led marketing teams at two successful SaaS startups and specializes in conversion optimization and multi-channel attribution modeling. Alex combines technical expertise with strategic thinking to deliver actionable insights for marketing professionals looking to improve their ROI.
Explore more topics