The Data Quality Crisis in Marketing Analytics: Why Your Dashboard Reports Don't Match Your Actual Performance
---
The Data Quality Crisis in Marketing Analytics: Why Your Dashboard Reports Don't Match Your Actual Performance
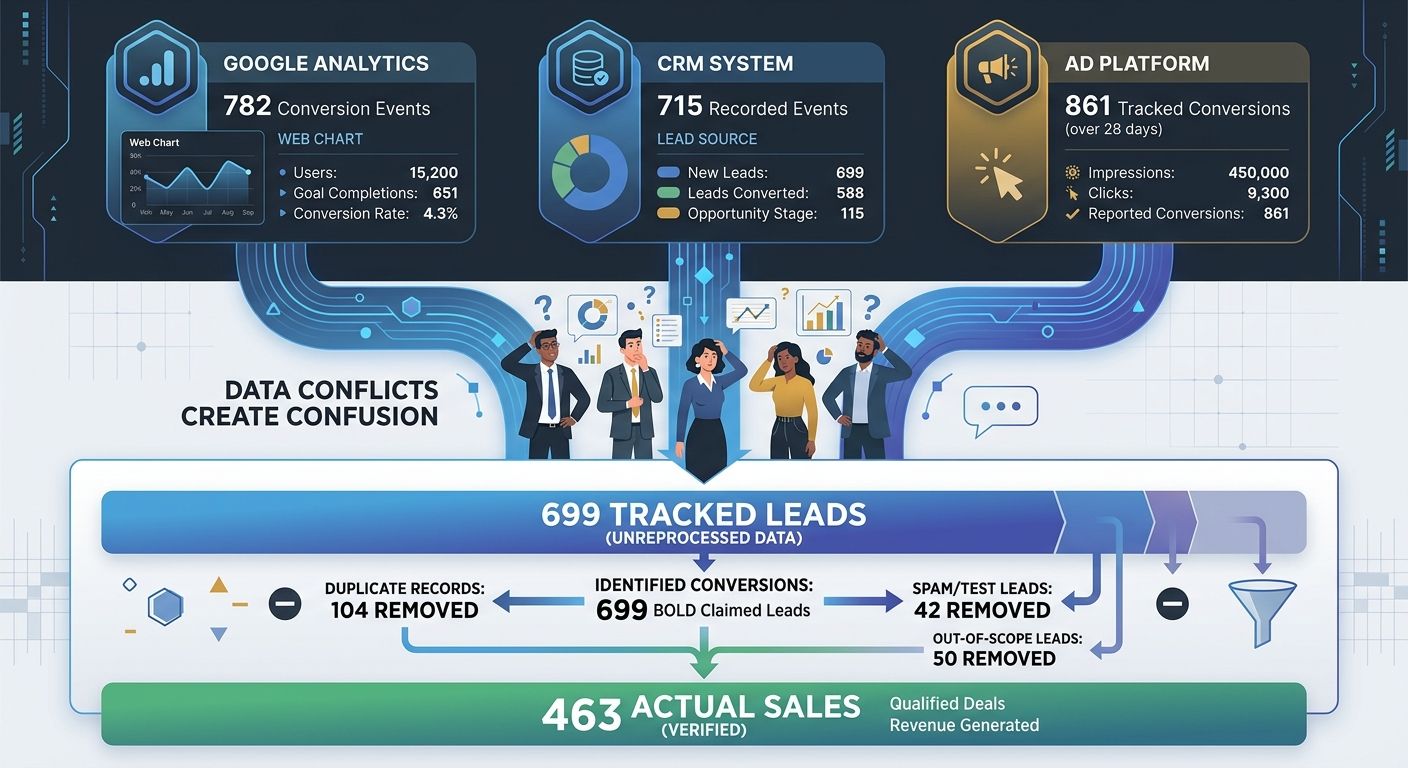
A client showed me their Q1 dashboard two weeks ago. Google Ads reported 412 conversions. Meta claimed 287. Their CRM had 463 closed deals total. Add up what the ad platforms claimed, and they'd supposedly driven 699 conversions out of 463 actual sales. The math didn't just fail to add up. It failed spectacularly.
This isn't an edge case. It's the norm. And if you've ever stared at your reporting wondering why the numbers feel wrong, it's because they probably are. The data quality marketing crisis isn't coming. It's already here, bleeding budgets dry while teams make confident decisions based on confidently incorrect numbers.
The Scale of the Problem Is Bigger Than You Think
Poor data quality costs organizations an average of $12.9 million annually, according to Gartner research. That's not a typo. And in marketing specifically, the damage compounds because every flawed data point cascades into flawed budget allocation, flawed targeting, and flawed performance reviews.
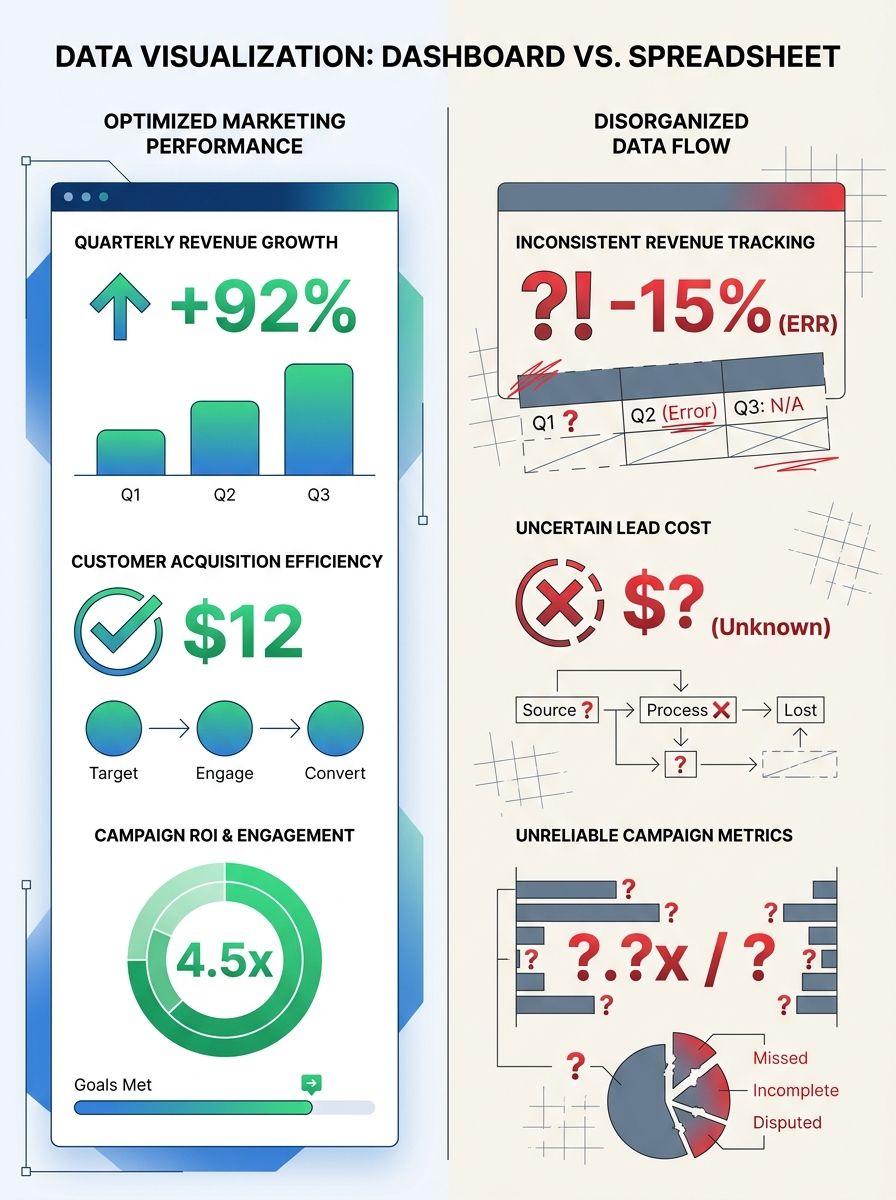
Here's what makes this so insidious: your dashboards look fine. The charts render beautifully. The numbers are precise to two decimal places. But precision without accuracy is just confident incorrectness, as Cometly's analysis of unreliable marketing metrics puts it. And confident incorrectness burns through budgets faster than almost anything else.
I've seen this pattern play out across dozens of enterprise accounts. The CMO presents a polished dashboard to the board. Finance pulls revenue numbers that don't match. Trust erodes. And suddenly, marketing is defending its existence instead of optimizing its performance.
Why Your Dashboard Numbers Are Wrong
The sources of data quality failure aren't mysterious. They're structural. And most teams are dealing with multiple failures simultaneously.
Client-Side Tracking Is Bleeding Data
If you're still relying primarily on pixel-based, client-side tracking, you're missing 30-50% of conversions. Ad blockers, Safari's Intelligent Tracking Prevention, Firefox's tracker blocking, and the deprecation of third-party cookies in Chrome have systematically dismantled the tracking infrastructure most marketing teams were built on.
A company seeing 100,000 sessions in Google Analytics may actually be receiving 140,000 or more. That means your conversion rates are inflated, your ROAS calculations are skewed, and your understanding of what's working is fundamentally distorted.
I wrote about why your analytics data often doesn't match reality in a deep dive on GA4 debugging. The tracking gap has only widened since then.
Platform Self-Attribution Bias
Every ad platform is grading its own homework. Meta, Google, TikTok, LinkedIn all use attribution windows and models that favor their own channels. When a user sees a Meta ad on Monday, searches on Google on Wednesday, and converts directly on Friday, both Meta and Google claim full credit.
Sum up what every platform reports, and you'll routinely exceed your actual sales by 40-80%. This isn't a bug. It's how these platforms are designed.
Inconsistent Data Sources Create Conflicting Truths
In a Hightouch analysis of 384 conversations with marketers, 96% cited data not flowing between tools as the primary reason their data wasn't working. That's not a gap. That's a canyon.
Your Google Analytics says one thing. Your CRM says another. Your ad platform says a third. And nobody knows which number to trust because you never established a single source of truth.
The Five Root Causes Behind Inconsistent Data
After auditing analytics infrastructure across more than 40 enterprise accounts, I've identified five root causes that appear again and again.
1. No Defined Source of Truth
Few teams ever explicitly decide which platform is authoritative for which metric. Your analytics platform should own web conversion data. Your CRM should own pipeline metrics. Your billing system should own revenue. But if you haven't documented these decisions and enforced them, as Dataslayer's guide to marketing data quality recommends, every meeting devolves into arguing about whose numbers are right.
2. UTM Parameter Chaos
I've seen UTM taxonomies that would make a librarian weep. Inconsistent capitalization, duplicate campaign names with slight variations, parameters that mean different things to different teams. One client had 47 variations of what was essentially the same campaign because three people were creating UTM tags without a shared standard.
3. Duplicate and Mismatched Records
Duplicate entries skew everything downstream. When the same contact exists three times in your CRM with slightly different email formats, you're triple-counting that lead in every report that touches the CRM. Matching errors compound the problem when data entries that should be treated as identical are recorded as separate records.
4. Broken Tag Implementations
Tags break silently. A developer pushes a site update, and suddenly your conversion tracking fires twice on the thank-you page. Or stops firing entirely. Without active monitoring, these breaks can persist for weeks before anyone notices a reporting anomaly.
5. Consent and Privacy Gaps
Privacy regulations and consent management add another layer of complexity. If your consent banner implementation is inconsistent across pages or regions, you're collecting partial data and treating it as complete. The numbers look authoritative. They're not.
Six Steps to Validate Your Dashboard
Knowing your data is broken isn't helpful without a fix. Here's the step-by-step process I use with clients to bring their reporting back to reality.
Step 1: Map Your Data Flow
Before you fix anything, document every tool in your marketing stack and how data moves between them. Draw the actual flow, not the intended flow. Where does a lead enter? What systems does it touch? Where does it exit? You'll almost always discover gaps, loops, or dead ends you didn't know existed.
When you're thinking about how your tools connect, it's worth evaluating whether your current tool stack is creating unnecessary complexity or actually serving your data needs.
Step 2: Establish Authoritative Sources
For each key metric, designate one system as the source of truth:
Web traffic and behavior: Google Analytics 4
Lead and pipeline data: Your CRM (HubSpot, Salesforce, etc.)
Revenue and transactions: Your billing or ERP system
Ad spend: Individual ad platforms (they're accurate about how much you spent, just not about what it achieved)
Every other system is a secondary reference. When numbers conflict, the authoritative source wins. No debates.
Step 3: Implement Server-Side Tracking
This is the single highest-impact technical change most teams can make. Server-side tracking recovers 20-30% of lost conversion data by bypassing ad blockers and browser restrictions. It gives you cleaner signals, more accurate attribution, and a foundation that doesn't crumble every time Apple ships a privacy update.
Yes, it's more complex to implement. Yes, it requires developer resources. It's still worth it.

Step 4: Build Reconciliation Checks
Schedule weekly automated comparisons between:
Platform-reported conversions vs. CRM new contacts
CRM pipeline value vs. actual revenue in billing
Total ad platform claimed conversions vs. actual total conversions
When discrepancies exceed 10%, investigate immediately. The trail goes cold fast.
Step 5: Standardize Your Tracking Taxonomy
Create a centralized UTM generator that enforces naming conventions. Lock down who can create campaign parameters. Document your taxonomy and share it across every team that touches paid media, email, or content distribution.
This sounds basic. It is basic. And almost nobody does it consistently.
Step 6: Run Regular Audits
Quarterly, at minimum, audit your entire tracking setup. Check that tags fire correctly. Verify that data flows match your documentation. Test conversion paths end-to-end. If you're also dealing with hidden disconnects between technical health and actual rankings, these audits catch problems across both your analytics and your organic performance.
The Organizational Problem Behind the Technical Problem
Here's what nobody wants to hear: the data quality crisis is roughly 25% technology and 75% organizational. You can implement perfect tracking, and it will degrade within months if nobody owns it.
Assign clear data ownership. Someone needs to be accountable for data quality metrics across the marketing org. Not as a side task. As a core responsibility.
Build data literacy across your team. When your content strategist doesn't understand what a conversion window is, they can't interpret the reports they're using to guide strategy. When your paid media manager doesn't know how the CRM defines a qualified lead, their optimization targets are disconnected from business outcomes.
This connects directly to understanding your data architecture well enough to trust your metrics. Without that foundation, every dashboard is a liability.
Tools That Actually Help
I'm not going to give you a laundry list of 30 platforms. Here's what matters most for dashboard validation and fixing inconsistent data sources:
Customer Data Platforms (CDPs) like Segment, BlueConic, or Tealium unify customer data from multiple sources into a single profile. If your data fragmentation problem is severe, a CDP is the most direct solution.
Data observability tools monitor your pipelines in real time and flag anomalies like missing events, broken integrations, or sudden volume changes. They catch the unknown unknowns.
Tag management systems like Google Tag Manager centralize your tracking implementation and reduce the odds of conflicting or duplicate tags.
Automated reconciliation dashboards that compare platform data against your source of truth. Google brought back Data Studio functionality, and your analytics stack decisions should account for reconciliation as a core use case, not an afterthought.

Start With Five Days of Reconciliation Work
You don't need a six-month project to start fixing this. Here's what you can do in the next five business days:
Monday: Pull conversion numbers from every ad platform and compare them against your CRM. Document the gap.
Tuesday: Map your current data flow on a whiteboard or in a tool like Miro. Identify where data enters, moves, and gets lost.
Wednesday: Designate authoritative sources for your top five metrics. Write it down. Share it with your team.
Thursday: Audit your UTM parameters from the past 90 days. Count the variations. Identify the inconsistencies. Build a standardized template.
Friday: Set up a recurring monthly reconciliation check. Even a simple spreadsheet comparison beats doing nothing.
The data quality crisis in marketing analytics won't solve itself. Every week you wait, you're making budget decisions on numbers that don't reflect reality. But the fix isn't buying a new tool or hiring a data scientist. It starts with deciding that accurate data matters more than impressive-looking dashboards, then doing the unglamorous work of making sure your numbers actually mean what you think they mean.
Your CEO doesn't need prettier charts. They need numbers they can trust. Start there.

Alex Chen
Alex Chen is a digital marketing strategist with over 8 years of experience helping enterprise brands and agencies scale their online presence through data-driven campaigns. He has led marketing teams at two successful SaaS startups and specializes in conversion optimization and multi-channel attribution modeling. Alex combines technical expertise with strategic thinking to deliver actionable insights for marketing professionals looking to improve their ROI.
Explore more topics