Benchmarking Your SEO Performance Against Industry Standards: A Data-Driven Framework for 2026
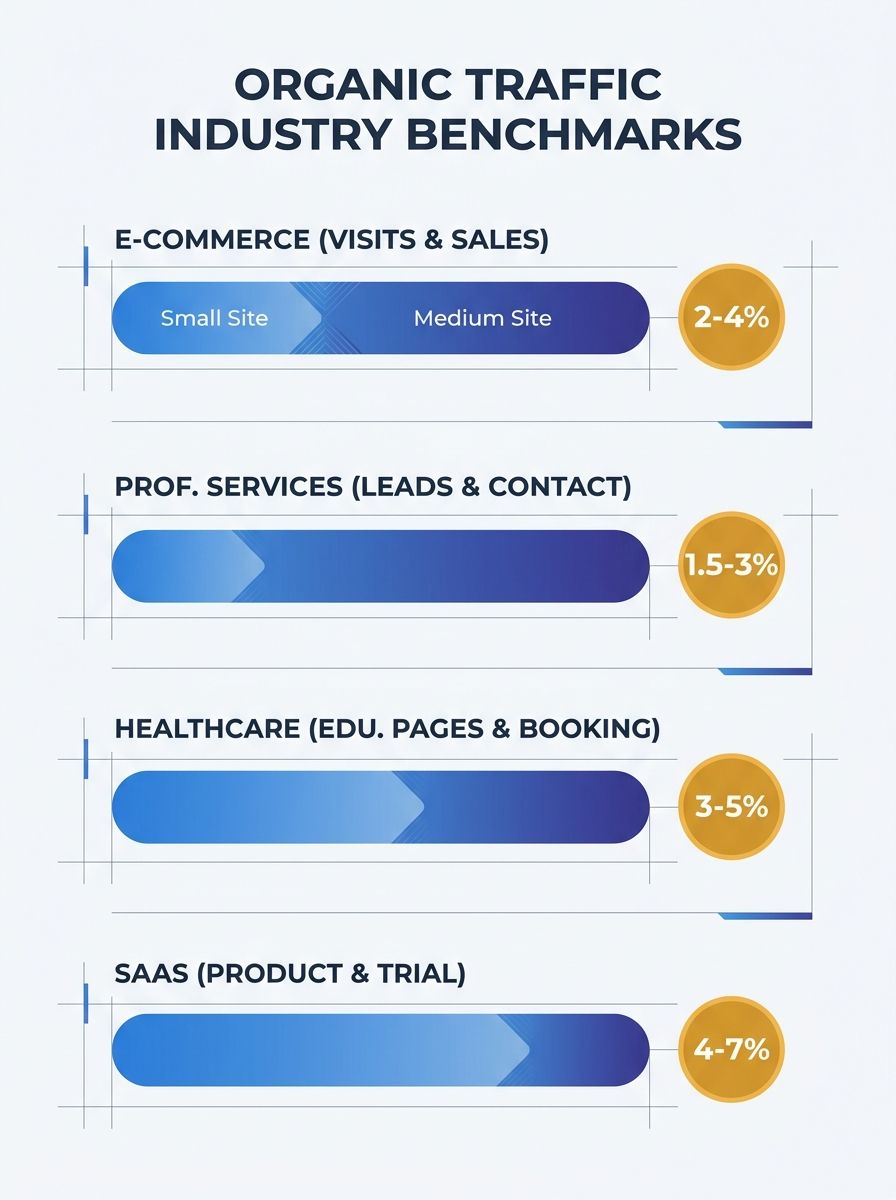
Small e-commerce sites average 4,000 to 12,000 organic sessions per month, while medium e-commerce sites pull in 25,000 to 80,000, according to cross-referenced data from SimilarWeb and SEMrush.
Benchmarking Your SEO Performance Against Industry Standards: A Data-Driven Framework for 2026
Small e-commerce sites average 4,000 to 12,000 organic sessions per month, while medium e-commerce sites pull in 25,000 to 80,000, according to cross-referenced data from SimilarWeb and SEMrush. Professional services firms operate in an entirely different range: 800 to 3,000 sessions for small firms, 4,000 to 20,000 for mid-market. These numbers might look like useful targets until you realize they tell you almost nothing about whether your SEO is actually working. Traffic volume without context is decoration on a dashboard. The real question is how to turn raw numbers into a benchmarking system that reveals where you're underperforming, where you're ahead, and where the competitive gaps worth closing actually live.
I've spent the better part of eight years building attribution models and organic growth strategies for SaaS companies and enterprise brands. The single biggest mistake I see marketing teams make with SEO benchmarking is treating it as a one-time comparison exercise. You pull industry averages, compare them to your own GA4 data, and either feel good or feel bad. That's not a framework. That's a mood check.
What follows is the approach I use with my own clients, built on three layers of measurement that connect organic search performance standards to actual business outcomes.
The Benchmark Problem: Why Industry Averages Mislead
Industry-level benchmarks provide useful orientation, but they collapse an enormous amount of variation into a single number. A "small e-commerce site" could be a niche DTC brand with 200 SKUs or a local retailer with 15 product pages. Their organic traffic profiles will look completely different, even within the same benchmark bucket.
The more useful approach is to treat published benchmarks as a sanity check and then build your own baselines from internal data. WebFX's 2026 SEO benchmarks report recommends setting separate baselines for each combination of page type (product, landing, blog) and traffic source in GA4. This is where SEO benchmarking becomes actionable instead of decorative.
A conversion rate of 2.1% across your entire site means very little. A conversion rate of 4.8% on product pages from organic search versus 1.2% on blog pages from organic search tells you exactly where to focus your optimization energy.
Layer One: Internal Baselines in GA4
Your first layer of benchmarking is entirely internal. Before you compare yourself to anyone else, you need GA4 normalized metrics that account for seasonality, page type, and intent category.
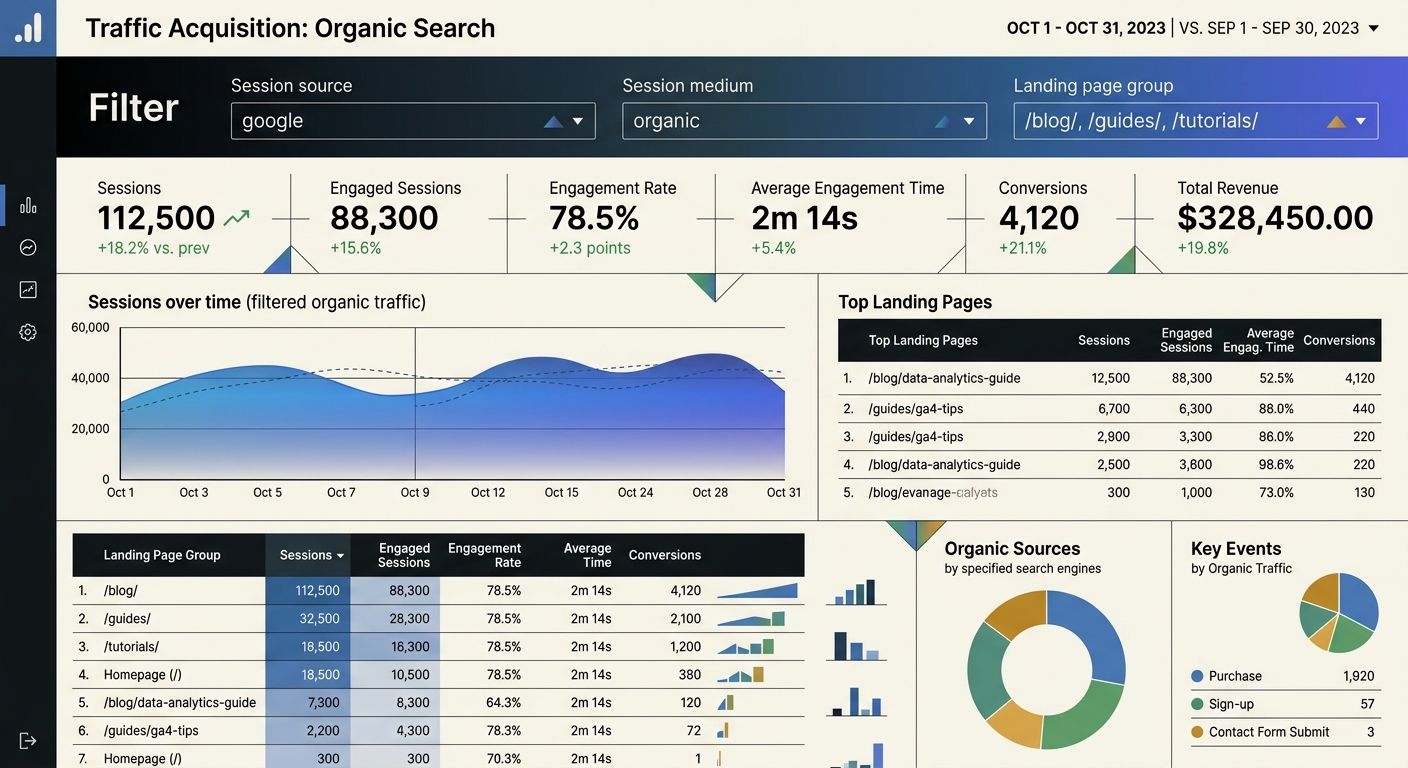
Navigate to your GA4 dashboard under Acquisition Reports, then Traffic Acquisition. Filter by Session Default Channel Group to isolate organic search. From there, you need to segment beyond the default view, because the default view hides the patterns that matter.
Segment by intent, not just by landing page
Break your organic traffic into four intent categories: navigational, informational, commercial investigation, and transactional. Map your top 50 landing pages by organic sessions into these buckets. You'll often find that 60-70% of your organic traffic is informational, which is fine for awareness but useless for pipeline attribution if you don't track how those sessions convert downstream.
If you've already built a keyword prioritization matrix with search intent mapped to business impact, this step is straightforward. If you haven't, start there before trying to benchmark anything.
Build 12-month rolling baselines
Single-month snapshots are noise. You need 12 months of rolling data to account for seasonal demand cycles. Pull total users, engaged sessions, and key events (conversions) from organic search for each of the past 12 months. Calculate the trailing average and the standard deviation. Any month that falls more than one standard deviation below your trailing average deserves investigation. Any month above it deserves documentation so you can replicate whatever drove the spike.
This is the foundation of GA4 normalized metrics: not raw numbers, but numbers contextualized against your own historical performance and adjusted for the rhythm of your specific business.
Layer Two: Competitive SEO Analysis That Goes Beyond Keyword Gaps
The second layer is competitive positioning. This is where most teams get it wrong, because they treat competitive SEO analysis as a keyword gap exercise and stop there.
A raw keyword gap report gives you a list of terms your competitors rank for that you don't. Useful starting point. Terrible ending point. As Search Engine Land's guide on AI-assisted competitor analysis points out, the real value comes from clustering those gaps into themes, then tiering them by intent and business relevance.
Map search competitors separately from business competitors
Your business competitors and your search competitors are often different entities. A B2B SaaS company selling project management software competes in business with Asana and Monday.com. But in organic search for "how to manage remote teams," they might compete with Harvard Business Review, Forbes, and a dozen HR consultancies. Benchmarking against Asana's domain authority when your real SERP competitors are media publishers will lead you to wrong conclusions about what "good" looks like.
For each of your top 10 keyword clusters, identify the domains that actually appear in positions 1-10. Those are your search competitors for that topic, and they're the ones you should benchmark against for content depth, backlink profile, and SERP feature capture.
Backlink quality benchmarks
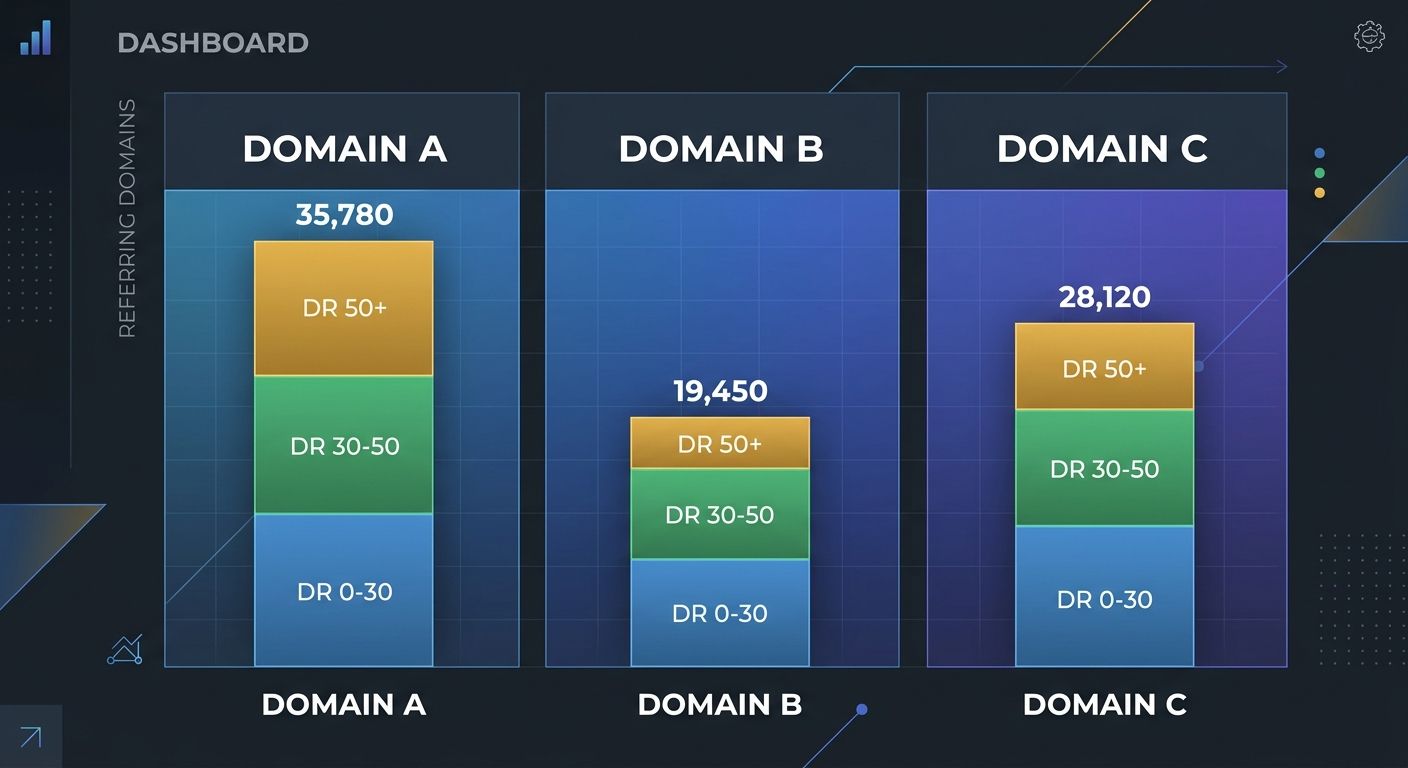
Position 1 results average approximately 365 referring domains, and the top 3 results carry about 13% more high-domain-rating backlinks than positions 4-10. But these averages shift dramatically by vertical. YMYL industries like finance, legal, and healthcare often require 500-600 referring domains for competitive queries.
The metric I care about more than total referring domains is the ratio of high-authority links (DR 50+) to total links. If your competitor has 400 referring domains but only 30 are DR 50+, while you have 200 referring domains with 80 at DR 50+, you're in a stronger position than the raw count suggests. Track this ratio quarterly as part of your competitive SEO analysis, and you'll make much better decisions about where to invest link-building resources.
Layer Three: AI Visibility and Zero-Click Measurement
Google AI Overviews now appear in 25.8% of all searches, climbing to 51.6% in health-related queries and 65.9% for long informational queries. Meanwhile, 58.5% of Google searches result in zero clicks. These two data points fundamentally change what organic search performance standards look like in 2026.
If your SEO benchmarking framework still treats "organic sessions" as the primary success metric, you're measuring a shrinking slice of your actual search visibility. A page ranking in position 1 can see its click-through rate drop by 15-20% when an AI Overview sits above it. We've explored how AI Overviews are reshaping what your analytics should track in detail, and the shift demands a practical response in how you measure success.
Track impression share alongside click-through rate
Google Search Console gives you impressions data that most teams underuse. For queries where AI Overviews dominate, your impression count may remain high while clicks decline. The gap between impressions and clicks is your zero-click exposure, and for top-funnel informational content, that exposure still has brand value even without the traffic.
Build a monthly report that segments your Search Console data into three buckets:
High-click queries (CTR above your category average): These are your revenue drivers. Protect them.
High-impression, low-click queries (CTR below average, impressions above 1,000/mo): These are zero-click candidates. Optimize for featured snippet capture or AI Overview inclusion rather than traffic.
Low-impression, low-click queries: Candidates for content refresh or deprecation.
This segmentation turns Search Console from a vanity dashboard into a strategic tool, which pairs well with the broader challenge of making your analytics tell an accurate story rather than a flattering one.
Monitor AI citation frequency
Beyond Google, AI platforms like ChatGPT, Perplexity, and Gemini are pulling your content into their responses. Research shows domains with strong presence on Reddit, Quora, and industry review sites are 3-4x more likely to be cited by AI systems. This creates self-reinforcing citation patterns: early presence in AI training data increases the likelihood of future citations.
Track whether your brand appears in AI-generated answers for your target queries. Do this manually at first (run your top 20 queries through ChatGPT and Perplexity, document which sources get cited), then build it into your monthly reporting cadence. The data from optimizing your content for AI-driven brand discovery feeds directly into this measurement layer.
Putting The Three Layers Together
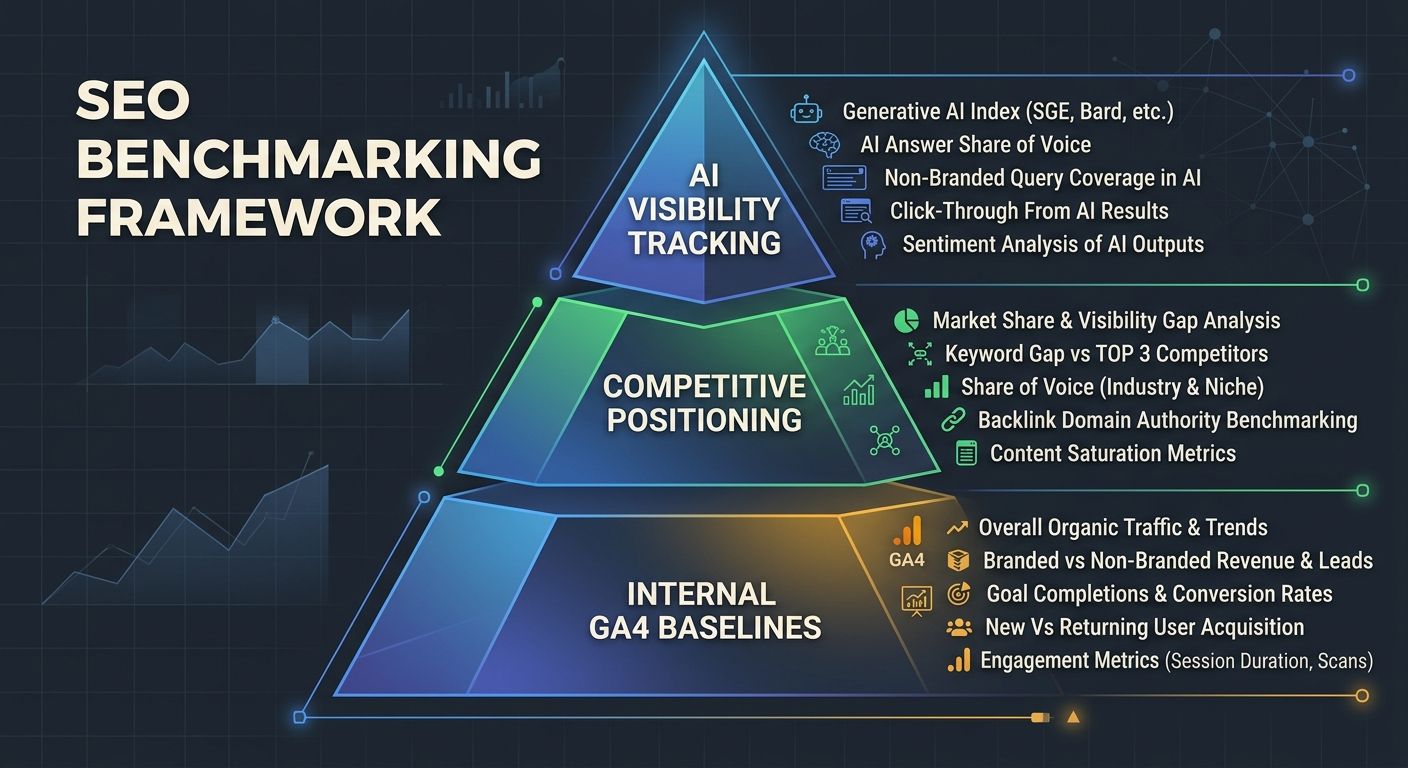
Your SEO benchmarking framework now has three distinct measurement surfaces:
Internal baselines: GA4 normalized metrics segmented by page type, intent category, and traffic source, tracked as 12-month rolling averages
Competitive positioning: Search competitor mapping per keyword cluster, with backlink quality ratios and content depth benchmarks
AI visibility: Impression-to-click gap analysis, zero-click exposure tracking, and AI citation monitoring
Each layer answers a different question. Internal baselines answer "are we improving?" Competitive positioning answers "are we winning?" AI visibility answers "are we visible where search is headed?"
The layers interact. If your internal baselines show organic sessions declining but your competitive positioning data shows you're gaining keyword positions, the explanation is almost certainly AI Overview displacement reducing CTR across your keyword set. That's a fundamentally different problem than losing rankings, and it requires a fundamentally different response. You wouldn't fix a CTR compression problem by building more backlinks, and this is exactly the kind of misdiagnosis that happens when teams struggle to communicate performance changes to leadership without proper context.
Set up a quarterly review cadence where all three layers are evaluated together. Monthly is fine for internal baselines, but competitive and AI visibility data don't shift fast enough to justify monthly deep dives.
Questions The Numbers Still Can't Answer
This framework tells you where you stand and whether you're gaining or losing ground. It does a reasonable job of isolating why a particular metric moved in a particular direction. But several gaps remain, and pretending otherwise would be dishonest.
First, AI citation tracking is still largely manual and inconsistent. No tool reliably measures how often your brand gets pulled into AI-generated answers across all platforms, and the platforms themselves change their citation behavior frequently. The 3-4x citation advantage for brands with strong community presence is a useful directional finding, but the exact multiplier will vary by vertical and query type.
Second, the relationship between zero-click impressions and downstream conversions is poorly understood. We know that brand impressions have value, but quantifying that value in a way that satisfies a CFO requires attribution modeling that current tools don't fully support. I believe multi-touch attribution is underused by most marketing teams, and the zero-click measurement gap is going to force more organizations to invest in it over the next 12-18 months.
Third, industry benchmarks like the 4,000-12,000 session range for small e-commerce sites are based on data aggregated across businesses with wildly different content strategies, domain ages, and competitive landscapes. They're directional, not prescriptive. Treat them as conversation starters with your leadership team about what "good" should look like for your specific business, not as targets to copy into a slide deck.
The companies that will separate themselves in organic search this year are the ones building their own benchmark infrastructure rather than borrowing someone else's. The data is there in GA4, Search Console, and your competitive intelligence tools. The framework above gives you a structure for reading it. The interpretation, and the strategic decisions that follow, still require a human who understands the business.

Alex Chen
Alex Chen is a digital marketing strategist with over 8 years of experience helping enterprise brands and agencies scale their online presence through data-driven campaigns. He has led marketing teams at two successful SaaS startups and specializes in conversion optimization and multi-channel attribution modeling. Alex combines technical expertise with strategic thinking to deliver actionable insights for marketing professionals looking to improve their ROI.
Explore more topics