The Content Production Bottleneck: Why Your Marketing Team Can't Keep Up With AI Content Demand
Paid media campaigns running across Google, Meta, TikTok, and LinkedIn collectively demand somewhere between 50 and 200 unique creative assets per month from a typical mid-market marketing team.

The Content Production Bottleneck: Why Your Marketing Team Can't Keep Up With AI Content Demand
Paid media campaigns running across Google, Meta, TikTok, and LinkedIn collectively demand somewhere between 50 and 200 unique creative assets per month from a typical mid-market marketing team. Ad copy variants, landing page iterations, display banners in multiple aspect ratios, video cuts, platform-specific social formats. Adobe Express's 2025 survey of 1,000 US marketers documented that AI-assisted teams produce 75% more content per week than those operating without AI tooling. That productivity gap should have solved the creative supply problem. Instead, 67% of US marketing professionals still report missing time-sensitive campaign moments because approval workflows can't keep pace with production speed.
The AI content scaling bottleneck has shifted. The constraint used to be drafting capacity. Now it's everything that happens after a first draft exists.
Where the Bottleneck Actually Lives in Paid Media
When I run audits on teams struggling with creative throughput, the writing itself rarely takes the longest. What kills campaigns is the chain of events between "draft complete" and "asset live in-platform."
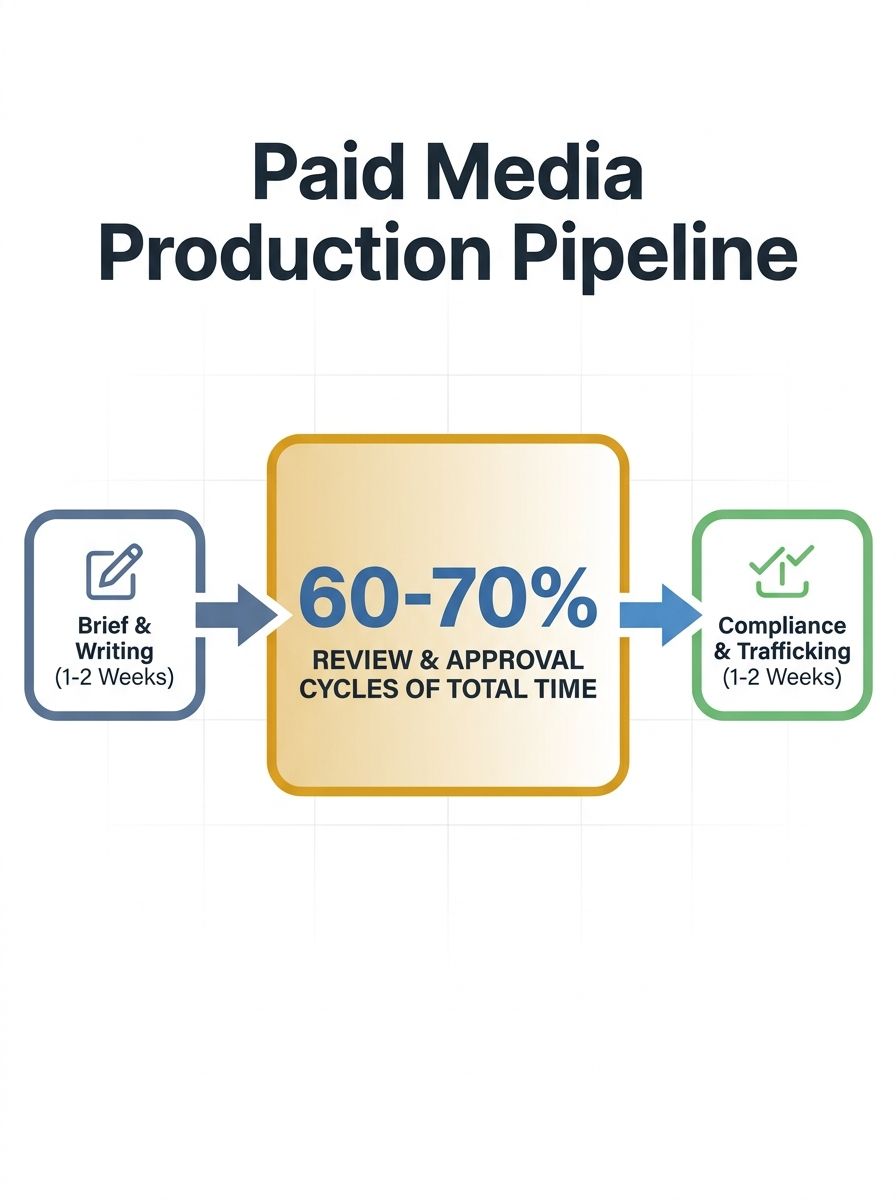
Consider the production pipeline for a single paid social campaign:
Brief creation and stakeholder alignment: 1–3 days
Copywriting and creative development: 1–2 days (with AI, often hours)
Internal review and revision cycles: 3–7 days
Legal or compliance approval (regulated industries): 2–5 days
Asset formatting for each platform: 1–2 days
QA and trafficking into ad platforms: 1 day
Add those up and you're looking at 9–20 business days for a campaign that should have launched while a trend was still relevant. AI compressed the copywriting step to near-zero, but the surrounding steps absorbed every hour that was saved.
As Sight AI's analysis of marketing bottlenecks documents, constraints shift as teams scale. Writing capacity might be the bottleneck this quarter; brief quality, keyword research, or distribution could become the constraint next quarter. Teams that treat bottleneck diagnosis as a recurring activity rather than a one-time fix are the ones that sustain content velocity over time.
The Paid Media Tax: Why Ad Creative Compounds the Problem
Blog content has a forgiving timeline. A post published Tuesday instead of Monday rarely costs you money. Paid media doesn't offer that slack. Every day a fatigued ad creative stays live without a refresh variant, your cost-per-click climbs. Meta's own auction system penalizes low-engagement creatives with reduced delivery and higher CPMs. Google's responsive display ads require multiple headline and description combinations to optimize effectively.
The math is punishing. A team managing $200K/month in ad spend across three platforms might need:
15–30 ad copy variants per platform per month
4–8 landing page versions for A/B testing
Display creative in 3–5 aspect ratios per concept
Video cuts at 6s, 15s, and 30s lengths
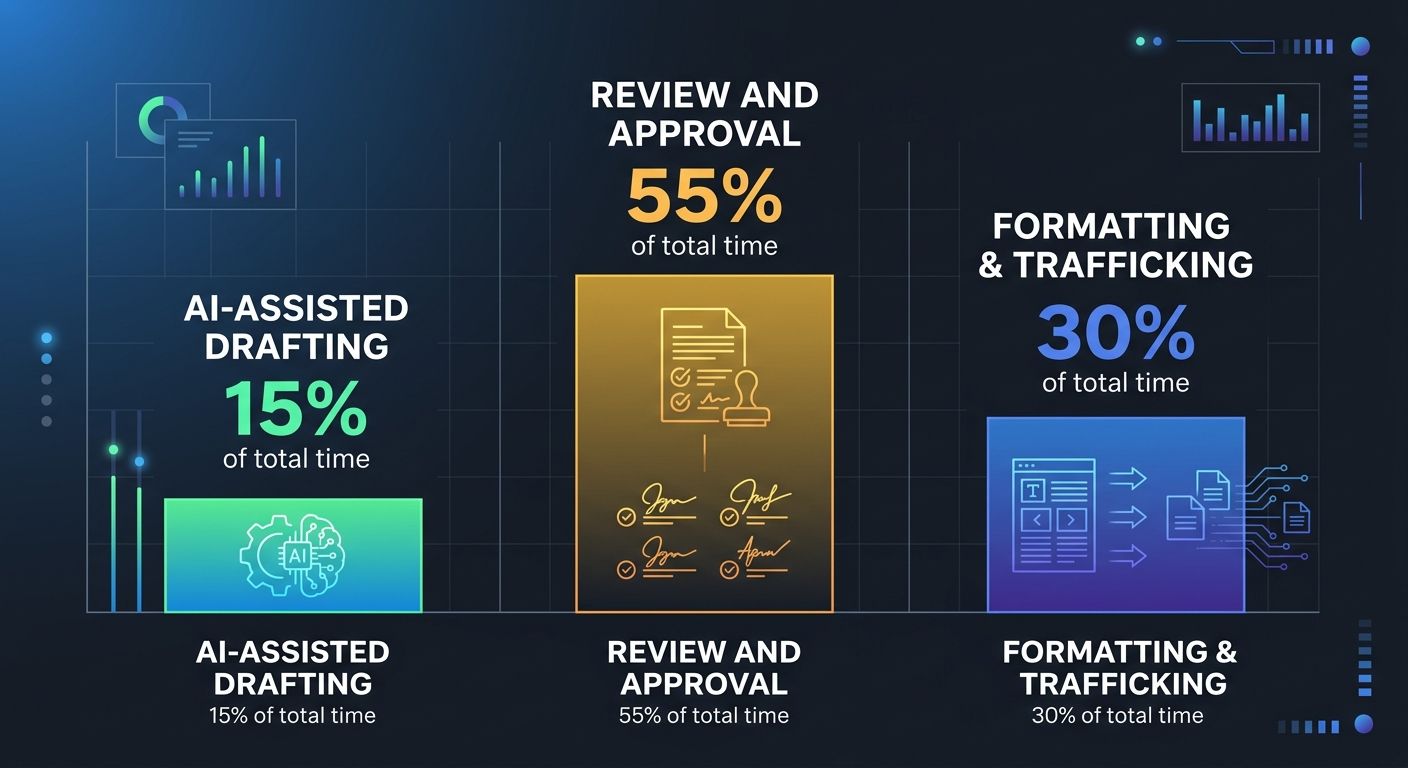
That's a minimum of 80–150 distinct assets. When your production pipeline data measurement shows that review cycles eat 60% of total production time, you've identified why creative refresh rates can't match campaign performance decay.
The teams I've worked with that crack this problem don't do it by hiring more designers or writers. They restructure the pipeline itself.
Measuring Your Editorial Process Efficiency
You can't fix a bottleneck you haven't quantified. The formula for editorial process efficiency metrics is straightforward, adapted from manufacturing process engineering: divide actual production time by total process time.
If your team spends 4 hours creating a set of ad variants but the total elapsed time from brief to live asset is 40 hours, your process efficiency is 10%. That means 90% of the pipeline is wait time, handoffs, and review loops.
Here's how to track this for your paid media content workflow:
Time-stamp every stage transition in your project management tool. When a brief moves from "assigned" to "draft complete" to "in review" to "approved" to "live," record the timestamp.
Calculate touch time vs. wait time. Touch time is when someone is actively working on the asset. Wait time is when it sits in a queue.
Segment by content tier. A CEO-quoted thought leadership landing page will (and should) have different cycle times than a standard product ad variant.
Benchmark monthly. Your first measurement establishes a baseline. Improvement targets should aim for 5–15% process efficiency gains per quarter.
Process metrics frameworks from Indeed apply the same efficiency formula across industries: Efficiency = Production time / Total process time. The principle translates directly to marketing operations.
If you're already tracking consistency metrics across your content operation, layering in cycle-time data gives you a much richer picture of where production actually stalls.
Tiered Review Workflows That Match Campaign Risk
The single most effective change I've seen teams make is abandoning one-size-fits-all approval processes. A social media ad variant and a regulated financial services landing page do not require the same review chain.
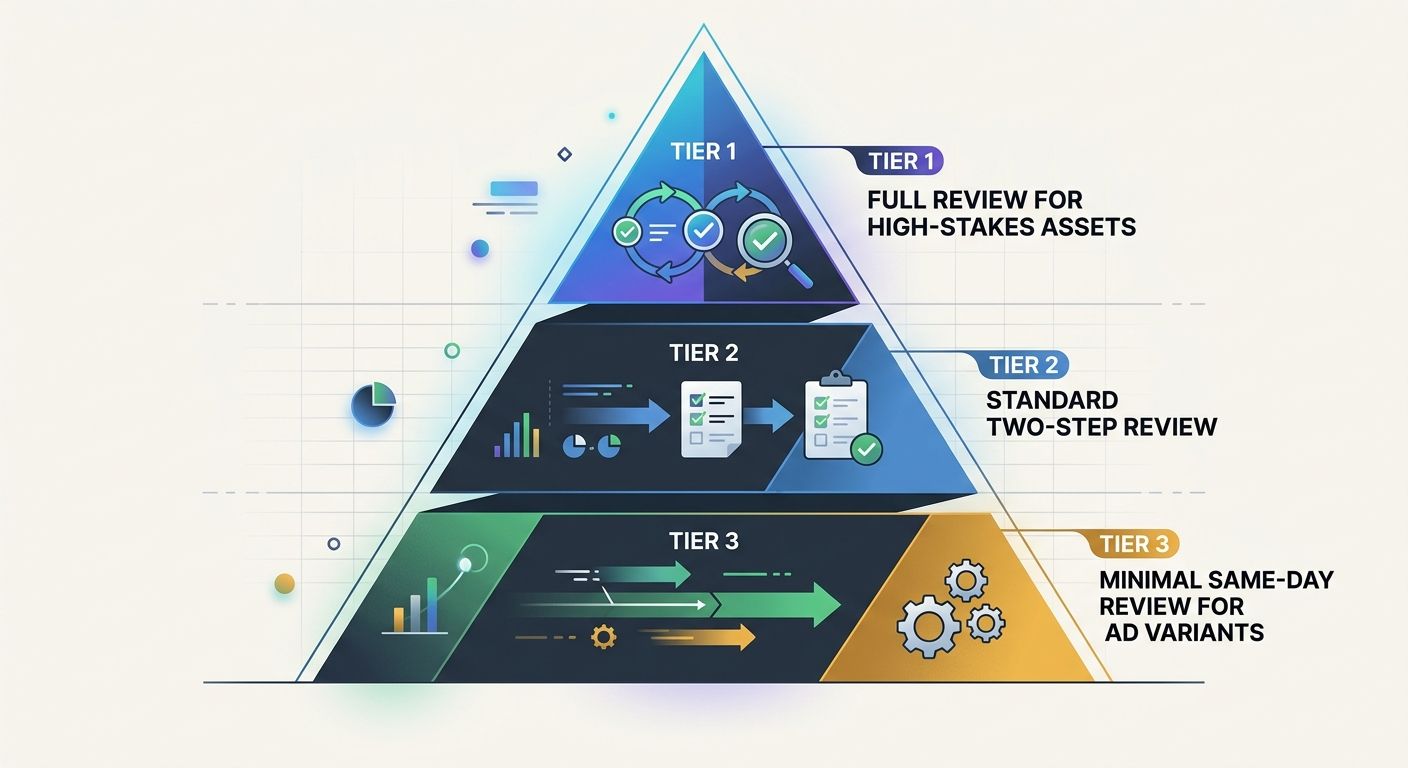
Tier 1: Full Review (High-Stakes Assets)
Campaign landing pages tied to major product launches, executive-attributed content, anything touching compliance-sensitive claims. Full creative review, legal sign-off, stakeholder approval. Accept the 10–15 day cycle time because the risk justifies it.
Tier 2: Standard Review (Core Campaign Assets)
Product ads, standard search copy, SEO-focused landing pages, email campaign assets. Two-step review: direct manager plus one subject-matter reviewer. Target 3–5 day cycle time.
Tier 3: Minimal Review (High-Volume Variants)
Social ad copy variants, A/B test iterations of already-approved concepts, format adaptations of existing creative. One reviewer with brand-guideline checklist authority. Target same-day or next-day turnaround.
This tiered approach cuts approval backlogs dramatically because it stops funneling every asset through the same narrow pipe. Teams adopting this structure, according to Sight AI's content automation analysis, free up senior reviewers to focus on Tier 1 work while Tier 3 assets move at the speed paid media campaigns actually require.
The structure works well within a repeatable sprint system where each sprint explicitly allocates review capacity across tiers.
Content Calendar Management AI and the Coordination Tax
Beyond review cycles, the other silent killer is coordination overhead. When your content calendar lives in a spreadsheet and platform-specific posting schedules live in three different tools, your team spends hours each week simply synchronizing plans rather than executing them.
According to Hootsuite's 2026 analysis of content calendar tools, 81% of marketing tech leaders are already piloting or using AI agents for scheduling, content generation, and post-timing optimization. That figure signals that content calendar management AI has crossed from early-adopter territory into operational mainstream.
Where these tools deliver measurable value for paid media teams:
Bulk scheduling across platforms eliminates manual publishing for organic content, freeing the team to focus creative energy on paid assets.
AI-generated content briefs reduce the brief-creation phase from days to hours by pulling from campaign objectives, keyword targets, and historical performance data.
Automated asset adaptation handles mechanical format changes (resizing, text overlay adjustments) that previously consumed designer hours.
Teams building their own custom automation tools can wire these calendar systems into their existing tech stack through platforms like Zapier, which connects AI models to publishing workflows, CMS platforms, and ad management tools without requiring engineering resources.
The meaningful shift here is treating content production workflow automation as infrastructure rather than a nice-to-have tool. When format adaptation, scheduling, and brief generation run automatically, your human team focuses exclusively on the work that actually requires judgment: strategy, messaging, and creative direction.
The Production Pipeline Numbers That Actually Matter for Paid Campaigns
I've seen teams track vanity production metrics (number of assets produced per week) that tell them nothing about campaign impact. The metrics that connect production efficiency to paid media performance are:
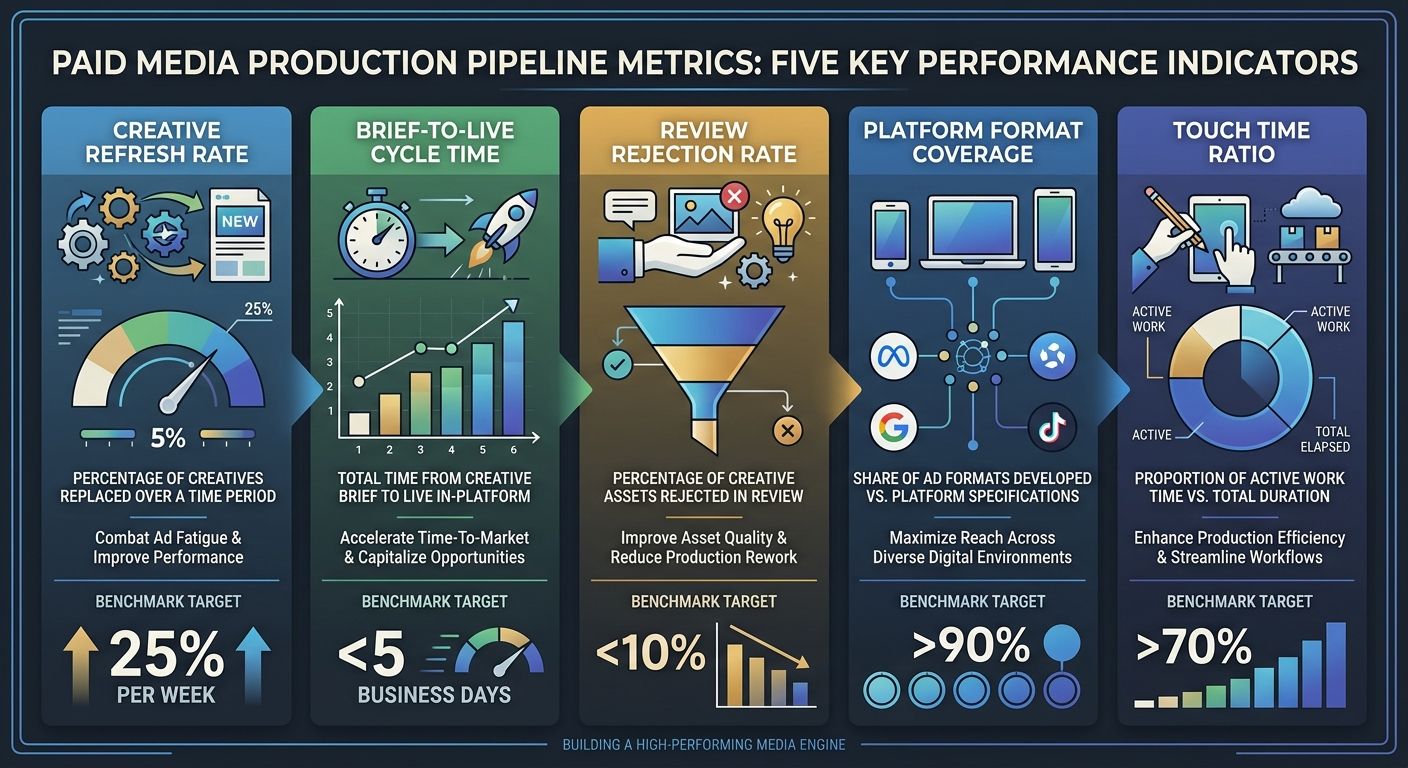
Creative refresh rate: How many days between new creative variants entering rotation per ad set. If your refresh cycle exceeds 14 days on Meta, expect CPM increases of 15–30%.
Brief-to-live cycle time: Total business days from approved brief to live asset in-platform. Track by tier.
Review rejection rate: Percentage of assets sent back for revision. A rate above 25% signals brief quality problems, not creative quality problems.
Platform format coverage: Percentage of required format variants actually produced per creative concept. If you're designing one hero image and skipping the 4:5 and 9:16 versions, you're leaving performance on the table.
Touch time ratio: Active production hours divided by total elapsed hours. This is your process efficiency score.
When you're already auditing your analytics for silent data gaps, adding production pipeline metrics to your reporting cadence takes minimal additional effort and dramatically improves visibility into why campaigns stall.
Questions the Data Can't Answer Yet
The Adobe Express survey confirms that AI-assisted teams produce more. The Sight AI research confirms that bottlenecks migrate from writing to review to distribution as teams scale. The 81% AI agent adoption figure from Hootsuite confirms that calendar automation is becoming standard.
What none of these datasets capture is the quality-adjusted output rate. Producing 75% more content per week means nothing if half of it underperforms the creative it replaced. AWS documented a 95% reduction in webpage assembly time using agentic AI, but assembly speed and conversion performance are different measurements with different implications.
The Content Marketing Institute's finding that 61% of content teams struggle to create assets for different buyer journey stages points to a deeper problem than velocity. Paid media teams face this acutely: a top-of-funnel awareness ad and a bottom-of-funnel retargeting landing page require fundamentally different messaging, even when promoting the same product. AI can draft both quickly. Whether those drafts actually move prospects through each stage is a question that requires campaign data, not production data.
The teams gaining the most ground right now are the ones treating their production pipeline as a system to be measured and iteratively improved, the same way they'd optimize a campaign. They track cycle times, identify constraints, restructure review tiers, and automate the mechanical work. They don't assume that faster drafting automatically translates to better campaign results. And they're building the measurement infrastructure to know the difference.

Alex Chen
Alex Chen is a digital marketing strategist with over 8 years of experience helping enterprise brands and agencies scale their online presence through data-driven campaigns. He has led marketing teams at two successful SaaS startups and specializes in conversion optimization and multi-channel attribution modeling. Alex combines technical expertise with strategic thinking to deliver actionable insights for marketing professionals looking to improve their ROI.
Related Articles

Marketing Departments Deploy Six-Stage AI Image Pipelines to Automate Visual Content Production
Marketing departments are deploying AI image automation workflows that generate, process, and publish visual content with minimal human intervention, according to a June 4, 2026 analysis from TrustAnalytica. The six-stage pipelines—spanning trigger, generation, processing, quality control, storage,

The Content Production Bottleneck: Why Your Publishing Timeline Kills SEO Performance
Inefficient content production workflows reduce marketing team productivity by up to 40%, and 45% of teams report they can't keep pace with their own publishing targets in 2026.

The SEO Workflow Breakdown: Building a Repeatable System That Scales With Your Team
Switching from ad-hoc SEO execution to a structured workflow system reduced time-to-publish from over two weeks to three to five days per content asset, while cutting brief creation time from two to three hours down to 30 minutes. These gains compound across every piece of content a team produces.
Explore more topics