The GA4 DebugView Workflow: Finding Hidden Data Collection Failures Before They Break Your Reports
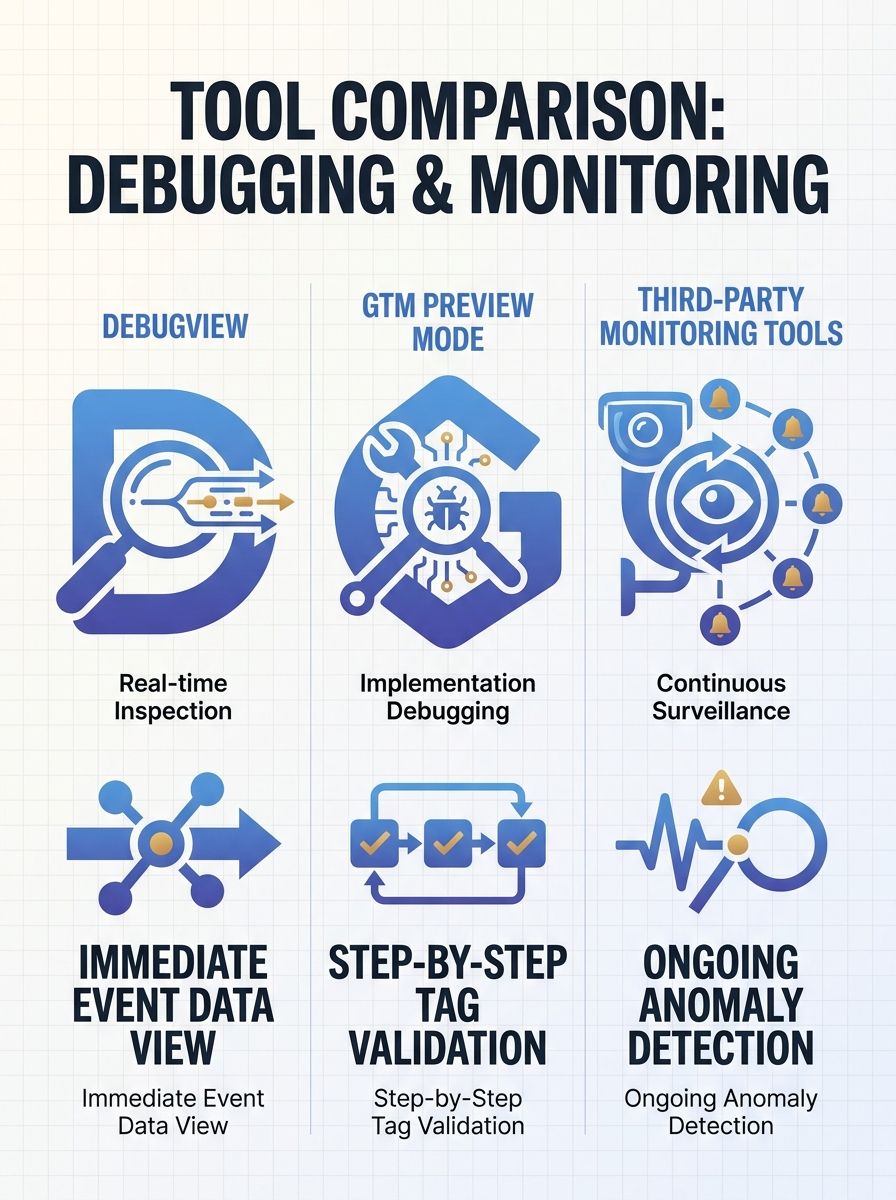
Catching hidden GA4 data collection errors requires three distinct validation approaches: DebugView for real-time event inspection, GTM Preview Mode for implementation-layer debugging, and third-party monitoring for continuous automated surveillance.
The GA4 DebugView Workflow: Finding Hidden Data Collection Failures Before They Break Your Reports
Catching hidden GA4 data collection errors requires three distinct validation approaches: DebugView for real-time event inspection, GTM Preview Mode for implementation-layer debugging, and third-party monitoring for continuous automated surveillance. Each catches failures the others miss, and choosing the right combination depends on your team's resources and how complex your implementation is.
A Goodish Agency audit in March 2026 found that 34% of a B2B SaaS client's recorded revenue tracking was broken by a race condition between their consent management platform and GTM's dataLayer initialization. The purchase event fired before the transaction_id and value parameters populated. Nobody noticed for weeks because the tags appeared to fire correctly in every surface-level check. Fixing the trigger sequence reduced discrepancies from 34% to under 2.1% and recovered $420,000 in monthly recurring revenue.
That audit captures the central problem: teams confuse "the tag fired" with "the tracking is correct." As GaFix.ai documented in their analysis of GA4 event tracking errors, "Teams tend to equate 'the tag fired' with 'the tracking is correct,' but in real GA4 audits, that assumption regularly falls apart." The three workflows below each attack a different layer of that assumption.
GA4 DebugView: The Real-Time Spot Check
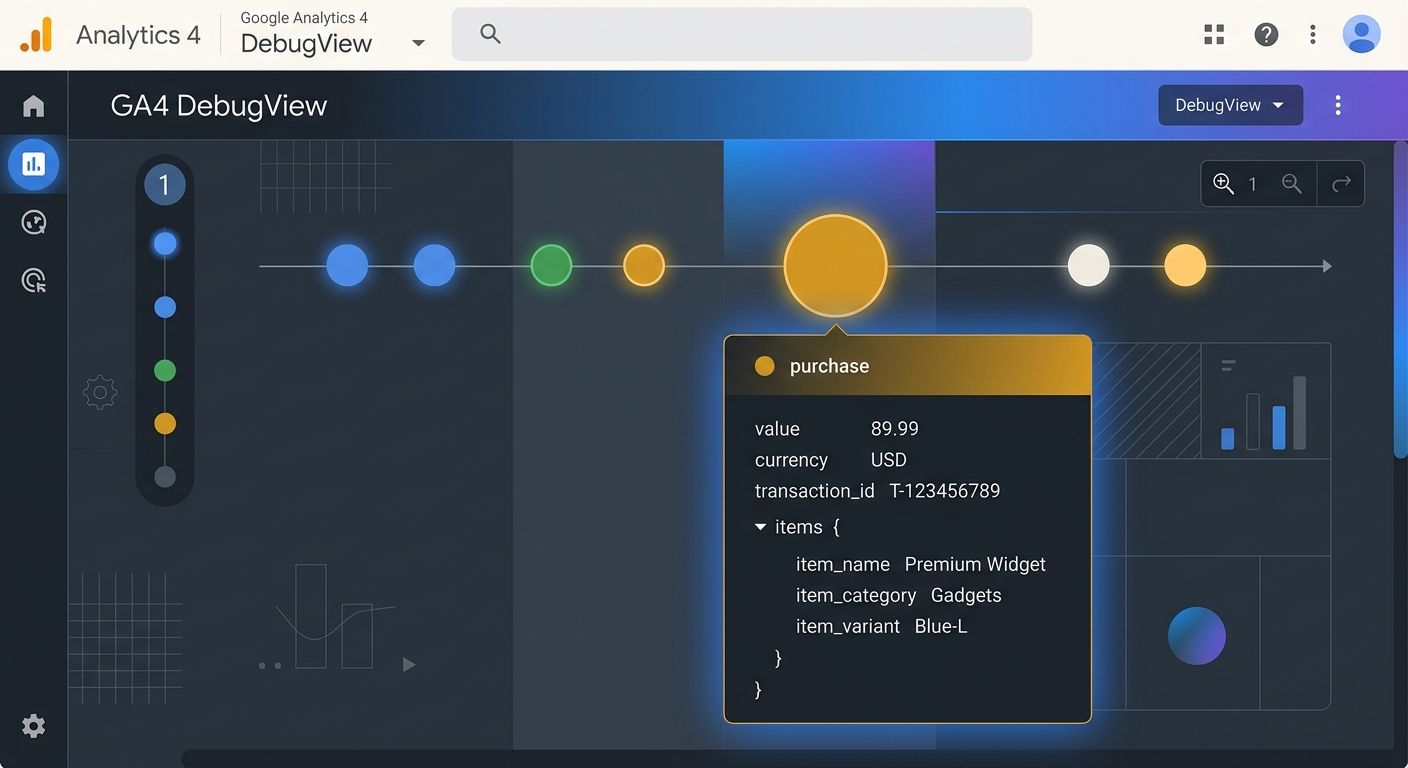
DebugView displays raw, unprocessed event data from a single debug-enabled device in real time. Unlike standard GA4 reports, which apply consent filtering, parameter validation, user identification, and privacy thresholding, DebugView shows every event hit as it arrives. That transparency makes it the fastest way to confirm whether an event fires, what parameters it carries, and whether those parameters match your tracking plan.
The setup is straightforward. You enable debug mode through one of three methods: installing the GA4 Debugger Chrome extension (1 click), adding the debug_mode parameter to your GA4 configuration tag in GTM, or appending the _dbg=1 query parameter to your page URL. Once active, events from your device appear in the DebugView panel within 1-3 seconds, color-coded by type: green for conversion events, blue for standard events, orange for errors.
Where DebugView shines is parameter-level inspection. Click any event in the timeline, and you see every parameter attached to it. For ecommerce implementations, this means verifying that purchase events include value as a number (not a string like "49.99"), currency formatted correctly (e.g., USD), transaction_id present and unique, and an items array with item_id, item_name, price, and quantity. According to Kissmetrics' March 2026 analysis, a value passed as a string instead of a number causes silent failures that DebugView won't flag but standard reports will simply ignore.
The biggest blind spot is consent mode. Kissmetrics identified consent mode as the most common hidden culprit behind missing purchase data in March 2026. Events from users who decline analytics cookies get filtered out of standard reports but appear perfectly normal in DebugView when you're testing with consent granted. If you only validate in debug mode with all consents accepted, you'll miss the exact failure path that affects a significant portion of your actual users.
DebugView also can't detect problems that happen while you aren't watching. A JavaScript update that breaks your dataLayer at 2 AM on a Saturday won't show up until someone opens DebugView on Monday morning. By then, you've lost 48+ hours of data.
GTM Preview Mode Catches What DebugView Cannot
GTM Preview Mode with Tag Assistant operates at the implementation layer, one level deeper than DebugView. While DebugView answers "did the event reach GA4?", Preview Mode answers "did the right tag fire, at the right time, with the right trigger, and the right variables?" Those are different questions, and the second one catches an entire category of errors the first one misses.
When you activate Preview Mode, Tag Assistant opens a connected panel that shows every tag in your container, its firing status, and the trigger that activated it. For each dataLayer push, you see the exact state of every variable at that moment. This is where you catch race conditions like the one in the Goodish Agency audit: the purchase tag firing before the dataLayer contained the transaction data. If you've ever gone through the process of auditing silent data loss in your GA4 setup, you know that trigger sequencing errors account for a disproportionate share of tracking failures.
Preview Mode also exposes duplicate tag firing. Google's own documentation warns that using both the Google tag snippet and Tag Manager snippets simultaneously "will have unintended consequences, such as overcounting data from your website." A March 2026 audit checklist from Fivestones.net identified 8 distinct audit areas where duplicate implementations create inflated metrics, with overlapping tracking systems (GTM plus a WordPress plugin, for example) flagged as the most frequent finding.
The practical workflow looks like this: enable Preview Mode in GTM, navigate through your site performing key actions (page loads, form submissions, purchases), and check three things for each action. First, confirm the correct tag fired (and no incorrect tags fired alongside it). Second, verify the trigger conditions matched what you intended. Third, inspect the variable values to ensure they contain the right data at the moment of firing.
The tradeoff is manual effort. Preview Mode requires a human being to walk through every user flow, on every relevant page, after every significant site change. For a 50-page ecommerce site with 12 tracked interactions, that's hundreds of individual checks. And like DebugView, it only tests in the moment you're actively looking. When I work with teams on building their analytics monitoring stack, I always position Preview Mode as the pre-launch validation step, never the ongoing surveillance system.
Third-Party Monitoring Fills the Overnight Gap
Third-party monitoring platforms like Track-Guard, Trackingplan, and OWOX address the critical limitation shared by DebugView and GTM Preview Mode: neither watches your tracking when you're not actively testing. These tools run continuous automated checks against your GA4 implementation and alert you when something breaks.
The value proposition is straightforward. A developer pushes a code change on Friday afternoon that accidentally removes the dataLayer push for add_to_cart events. Without monitoring, you lose 2-3 days of conversion funnel data before anyone notices the gap in Monday's reports. With automated monitoring, you get an alert within minutes to hours of the failure.
Track-Guard, for instance, provides real-time alerts and broken tag detection specifically for GA4 implementations. Trackingplan takes a different approach, monitoring the actual data flowing from your site and comparing it against your tracking plan specification to flag deviations. OWOX, as of April 2026, emphasizes using GA4's built-in Anomaly Detection alongside their platform to catch data deviations automatically.
What these tools catch that the other two methods miss:
Gradual data drift: a parameter that starts returning null values for 3% of events, growing to 15% over weeks
Consent-mode-specific failures: events that fire correctly for consented users but produce malformed data for non-consented sessions
Cross-domain tracking breaks: session fragmentation when domain linking configurations change or expire, which causes problems across your entire analytics foundation
Thresholding suppression: GA4 applies privacy thresholding when Google Signals is enabled and event volumes are low, hiding data in reports behind a shield icon
The cost and complexity tradeoff is real. Track-Guard and Trackingplan charge monthly fees ranging from $50-500+ depending on traffic volume and feature tier. Setup requires granting access to your GTM container and GA4 property, and initial configuration takes 2-8 hours depending on implementation complexity. For teams managing 3+ GA4 properties or sites with frequent code deployments, the ROI calculation typically favors automated monitoring. For a single property with infrequent changes, the cost may outweigh the risk.
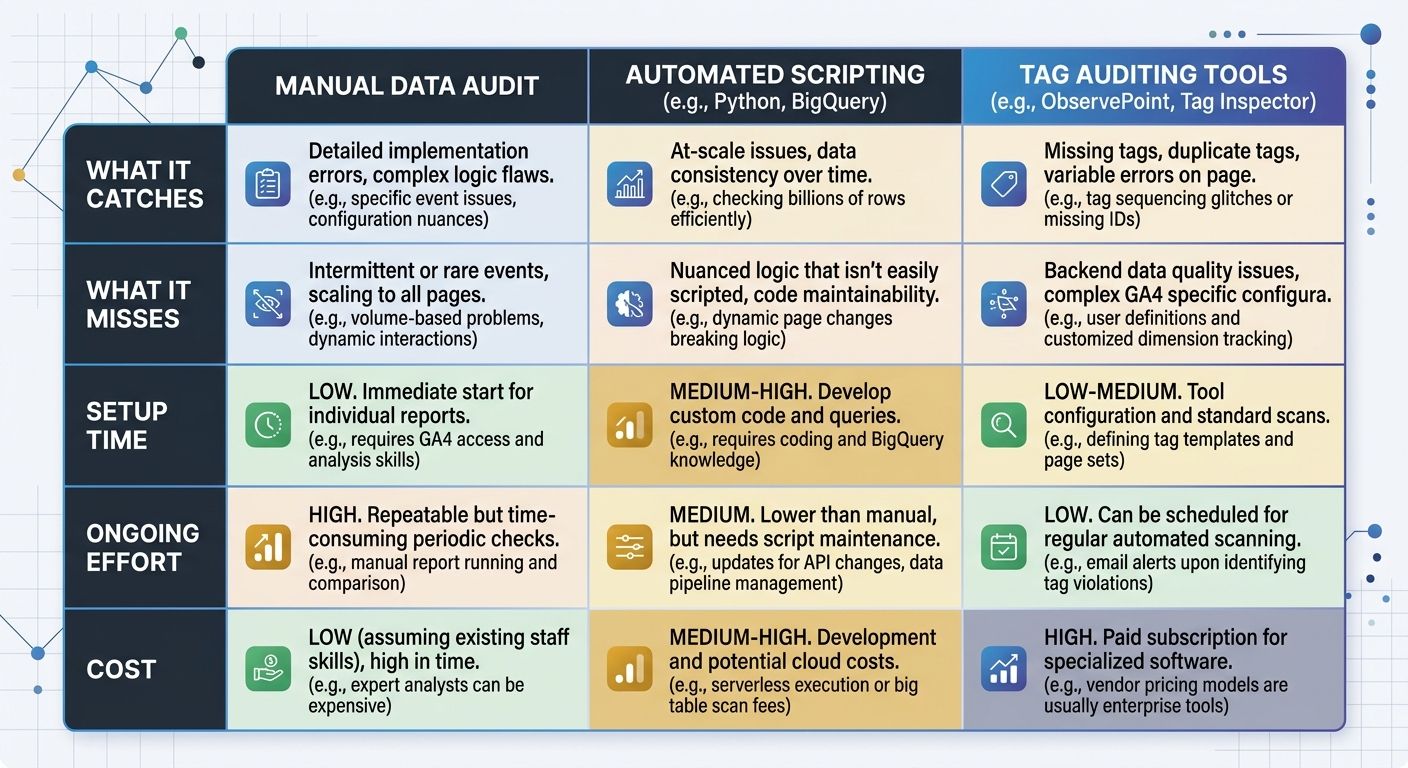
Side-by-Side Comparison
Dimension | DebugView | GTM Preview Mode | Third-Party Monitoring |
|---|---|---|---|
What it catches | Missing events, wrong parameters, parameter format errors | Duplicate tags, trigger sequencing, race conditions, variable misconfigurations | Gradual data drift, overnight failures, consent-mode gaps, cross-domain breaks |
What it misses | Consent-mode filtering, thresholding, failures when not testing | Same as DebugView for timing; can't detect post-deployment drift | Implementation logic errors (only sees output, not cause) |
Setup time | 1-5 minutes | 5-15 minutes per session | 2-8 hours initial configuration |
Ongoing effort | Manual, per-session | Manual, per-deployment | Automated with alert review |
Cost | Free (built into GA4) | Free (built into GTM) | $50-500+/month |
Best for | Quick spot-checks, new event validation | Pre-launch QA, tag conflict resolution | Continuous surveillance, multi-property environments |
Circles Studio noted in April 2026 that DebugView and Realtime reports are "your best friends" for validating event flow before going live. That's accurate for pre-launch validation. The gap is everything that happens after launch, which is where the third-party layer earns its cost.
Teams that handle ecommerce tracking with 10+ custom events across 50+ pages should consider all three layers. The mathematics work out clearly: if a single day of broken purchase tracking costs you $14,000 in misattributed revenue (the Goodish Agency client was losing roughly that amount daily before the fix), even the most expensive monitoring tool pays for itself within hours of catching one failure.
How To Choose Between These Three
The honest answer: you probably need two. The question is which two.
If you're a small team managing a single GA4 property with fewer than 10 custom events and infrequent site changes, DebugView plus GTM Preview Mode covers your needs. Run Preview Mode before any deployment, use DebugView for quick spot-checks when something looks off in reports, and build a monthly habit of walking through your key user flows in debug mode. This combination costs nothing and catches 80-90% of implementation errors if you're disciplined about the routine.
If you manage 3+ properties, run an ecommerce site with frequent code deployments, or have experienced a data loss incident that took more than 24 hours to detect, add third-party monitoring as your third layer. The overnight and weekend coverage alone justifies the expense for any site where a single day of broken tracking creates measurable revenue impact.
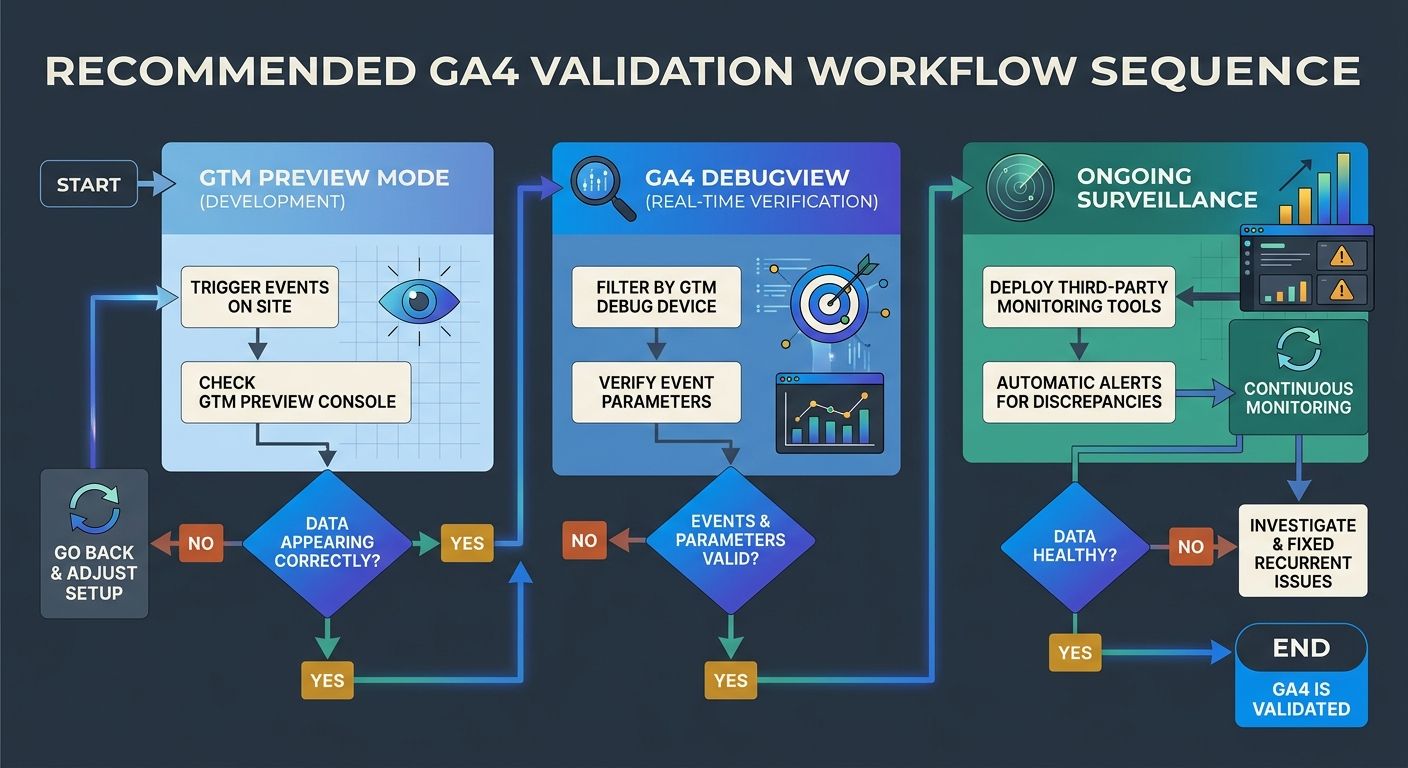
Whichever combination you choose, the validation workflow follows the same sequence: GTM Preview Mode during development and deployment, DebugView for real-time event-level confirmation, and monitoring (automated or manual) for ongoing data collection errors. The teams I've worked with that treat their site architecture as a data foundation rather than a one-time setup tend to build this kind of layered validation naturally, because they already understand that analytics infrastructure requires the same ongoing maintenance as the site itself.
The Goodish Agency case study makes the stakes concrete. That 34% revenue tracking failure wasn't caused by incompetence. It was caused by a consent platform update that changed timing behavior by approximately 200 milliseconds. The tags fired. The events appeared in DebugView. The parameters looked correct in isolation. The failure only revealed itself when someone compared GA4 revenue against the payment processor and found a $420,000 monthly gap. Building event tracking validation into your deployment process, rather than treating it as a one-time setup task, is how you catch the next 200-millisecond timing shift before it compounds into six figures of misattributed revenue.

Sarah Chen
SEO strategist and web analytics expert with over 10 years of experience helping businesses improve their organic search visibility. Sarah covers keyword tracking, site audits, and data-driven growth strategies.
Related Articles

The Benchmarking Blindspot: Why Your Analytics Comparison Strategy Is Missing Critical Industry Context
GA4 benchmarking groups your site into one of 15 industry categories and compares engagement rate, sessions, and bounce rate against anonymized peers within that bucket.

The Data Governance Audit: Why Your Analytics Stack Fails Without Formalized Data Management Processes
Sixty-two percent of analytics project failures trace to organizational and management breakdowns rather than technology problems, according to a clustering analysis of 19 industry expert commentaries compiled by Becker in 2017.
The SEO Benchmarking Cadence Audit: How to Stop Tracking Vanity Metrics and Start Making Data-Driven Ranking Decisions
The benchmarking cadence audit replaces static annual metric reviews with a three-frequency system — weekly pulse checks, monthly trend analysis, quarterly strategic pivots — where each layer filters SEO KPIs through conversion impact.
Explore more topics