The Benchmarking Blindspot: Why Your Analytics Comparison Strategy Is Missing Critical Industry Context
GA4 benchmarking groups your site into one of 15 industry categories and compares engagement rate, sessions, and bounce rate against anonymized peers within that bucket.

The Benchmarking Blindspot: Why Your Analytics Comparison Strategy Is Missing Critical Industry Context
GA4 benchmarking groups your site into one of 15 industry categories and compares engagement rate, sessions, and bounce rate against anonymized peers within that bucket. Three distinct approaches to analytics competitive analysis exist today, each hiding different blind spots in how industry context gets applied, and picking the wrong one distorts every strategic decision downstream.
GA4's Native Benchmarking: Free, Fast, and Dangerously Broad
GA4's benchmarking feature compares your performance across seven core metrics—sessions, views, users, average session duration, engagement rate, bounce rate, and conversions—against anonymized industry peers who opt into data sharing. The data is real. The categorization is the weak link.
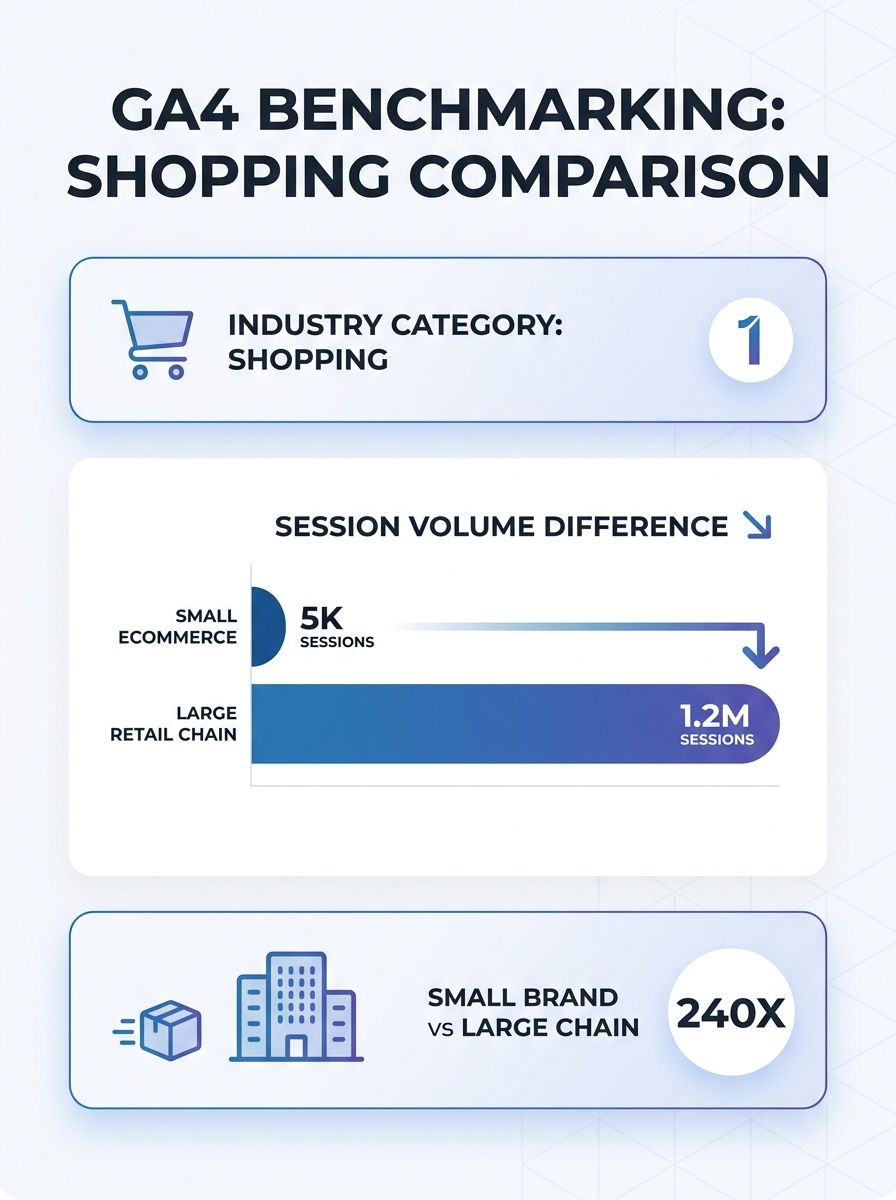
Google divides all participating properties into 15 industry verticals. "Shopping" contains everything from single-product Etsy alternatives to multinational retailers. "Technology" lumps SaaS platforms with consumer electronics review blogs. When Databox examined GA4 benchmarks across these 15 industries, the variance within each category was wide enough to make the median almost meaningless for individual strategic decisions.
The distinction between normalized vs unnormalized metrics compounds the problem. GA4's benchmarking initially relied on normalized metrics, which are percentages and ratios like engagement rate and bounce rate. These mask the absolute scale differences between businesses. A 62% engagement rate looks identical whether it comes from 800 monthly sessions or 800,000. Google expanded benchmarking to include unnormalized metrics like raw session counts and revenue in 2025, which helped surface scale differences, but the industry buckets remain the same 15 categories.
If your analytics tag implementation has gaps, the benchmarking data gets worse. Garbage in, garbage out applies doubly when you're comparing flawed internal data against an already-imprecise external benchmark. Getting your GA4 event tracking clean before trusting any benchmark comparison is a prerequisite, not an optimization.
Where GA4 benchmarking works well: Quick directional checks. If your bounce rate is 72% and the industry median is 48%, something is structurally wrong regardless of categorization imprecision. The tool excels at identifying outlier performance where you're so far from the median that the broad category doesn't matter.
Where it breaks down: Any decision requiring 5-10% precision. Budget allocation across channels, conversion rate optimization targets, and engagement benchmarks all need tighter cohort matching than 15 industry buckets provide.
Third-Party Aggregators and the Sample Bias Problem
Platforms like Databox, Similarweb, and SEMrush offer industry performance comparison with more granular segmentation, often 50+ subcategories compared to GA4's 15. They also benchmark metrics GA4 doesn't surface natively, including organic traffic share, paid search cost-per-click ranges, and content engagement by format.
Databox's benchmark groups let you filter by company size, monthly traffic range, and business model (B2B vs. B2C vs. ecommerce). This tighter cohort matching produces more relevant comparisons. A B2B SaaS company with 10,000 monthly sessions comparing against other B2B SaaS companies in the 5,000-20,000 range gets a genuinely useful competitive read.
Sara Vicioso of Workshop Digital described GA4's benchmarking feature as a tool that "gives valuable insights into how your business stacks up against industry peers, helping you identify strengths and areas for improvement." Third-party platforms take that concept further by adding the dimensional filtering that GA4 lacks.
The tradeoff is sample bias. These platforms benchmark against their own user base, not the entire market. Databox benchmarks reflect companies that use Databox. Similarweb's traffic estimates carry a documented margin of error that varies by site size, with smaller sites showing larger estimation gaps. If your actual competitors aren't well-represented in the platform's dataset, your "industry benchmark" reflects a skewed sample of companies that happen to use the same tool.
Cost matters too. Similarweb's competitive intelligence tiers start around $199/month. SEMrush's benchmarking features require Business-tier plans at $499/month. Databox offers free benchmark groups but gates advanced filtering and historical comparisons behind paid plans. Choosing the right analytics platform to power your performance monitoring is a separate decision that compounds with your benchmarking tool choice.
Where third-party aggregators work well: Mid-market companies ($5M-$100M revenue) with 3-5 identifiable competitors who also use mainstream analytics tools. The subcategory filtering genuinely narrows the comparison cohort, and multi-metric coverage gives a broader competitive picture than GA4 alone.
Where they break down: Niche industries, emerging verticals, and markets where your real competitors are private companies with limited digital footprints. The sample bias is invisible because you can't see which companies are and aren't in the benchmark set.
Building Custom Peer-Group Frameworks
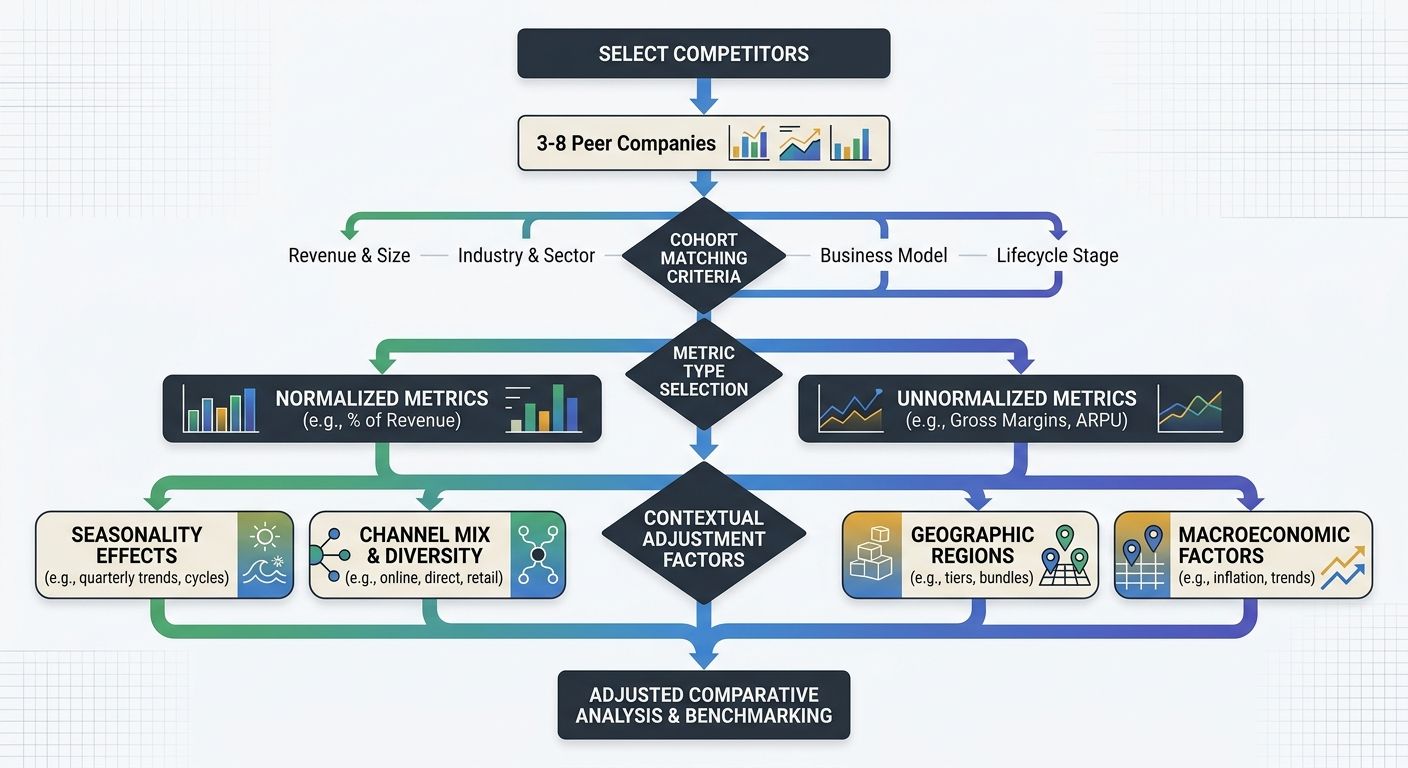
Why do the first two approaches keep missing context? Because they impose categorization rather than letting you define it. Building a custom benchmarking framework means selecting your own comparison cohort of 3-8 specific competitors, defining which metrics matter for your business model, and normalizing data across sources to make apples-to-apples industry performance comparison possible.
This approach addresses the core limitation of both GA4 and third-party tools: you control the context layer. Normalization, which involves adjusting metrics to account for differences in tracking systems, traffic sources, and business scale, becomes something you design rather than something imposed by a platform's default categories.
The Octopus Competitive Intelligence Agency describes effective benchmarking as a process that "turns ad hoc competitor checks into a repeatable, defensible process that coordinates product, pricing, and go-to-market." Custom frameworks deliver on that promise because every comparison is built around your specific competitive set, with full awareness of how your site structure affects the data flowing into each metric.
Fragments.ai's analysis of competitive benchmarking failures found that blind spots in standard benchmarking "create performance measurement that optimizes operations while missing the competitive performance gaps that determine market success." That finding maps directly to what I see with teams relying on GA4's 15-category system for decisions that require 50-category precision.
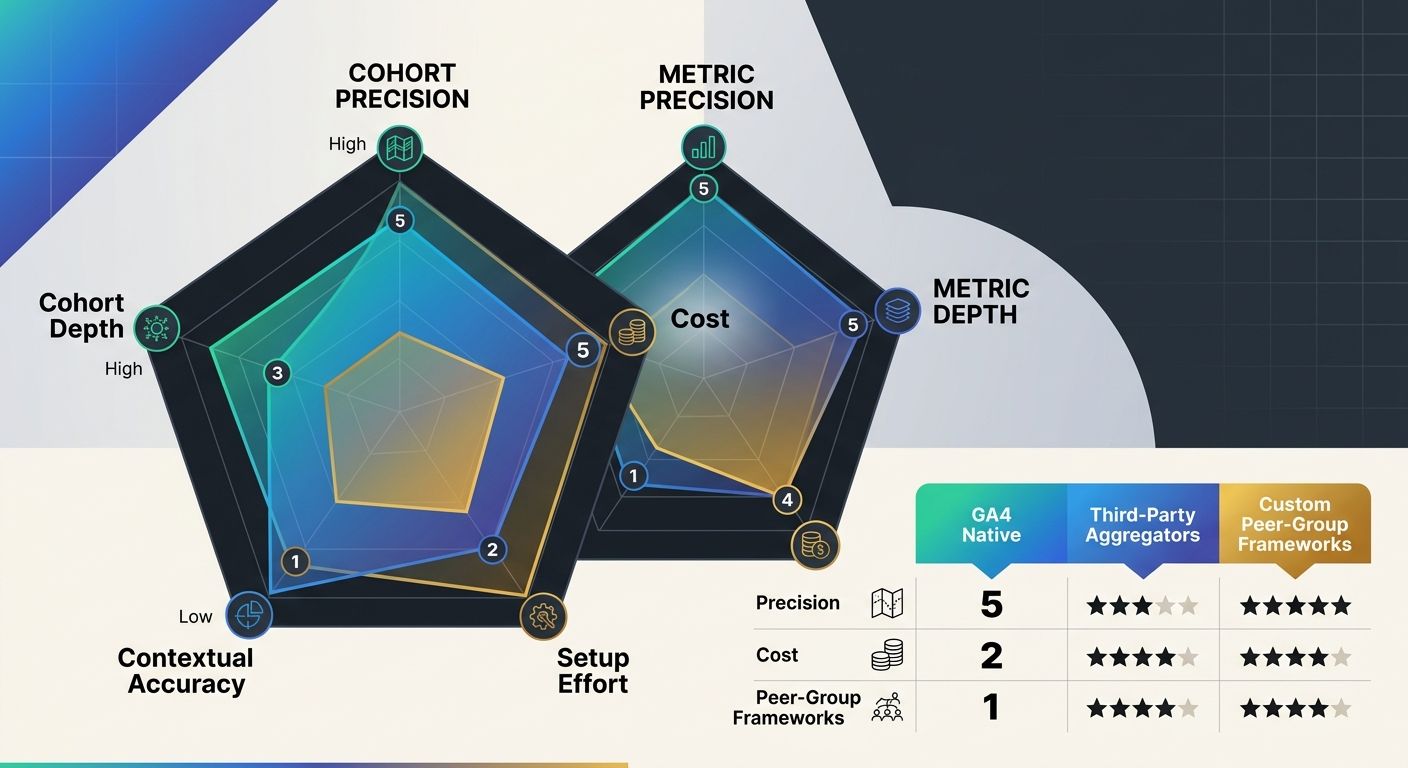
A practical custom framework evaluates competitors across three dimensions, which I call the Cohort-Metric-Context model:
Cohort precision: Are you comparing against companies with similar traffic volumes, business models, and market positioning? A peer group of 5 companies matched on revenue range, audience geography, and primary acquisition channel produces dramatically different benchmarks than an industry average.
Metric depth: Are you tracking both normalized metrics (conversion rate, engagement rate) and unnormalized metrics (absolute sessions, total revenue, page count)? The gap between these two metric types determines whether you can detect scale-driven differences that percentage-based comparisons hide entirely.
Contextual normalization: Are you accounting for seasonality, product launch cycles, and channel mix when comparing performance periods? A competitor's Q4 spike during holiday season tells you nothing about their baseline performance.
The effort requirement is real. Building a custom framework takes 20-40 hours of initial setup: identifying competitors, mapping their digital presence across tools, establishing data collection cadences, and building dashboards. Monthly maintenance runs 5-10 hours depending on competitor set size.
Where custom frameworks work well: Companies spending $50,000+ monthly on digital marketing, operating in verticals with fewer than 20 meaningful competitors, or making strategic bets where a 3-5% benchmarking error translates to six-figure misallocation.
Where they break down: Teams without a dedicated analyst, early-stage companies where the competitive landscape shifts quarterly, and situations where speed-to-insight matters more than precision.
Side-by-Side Comparison
Criteria | GA4 Native Benchmarking | Third-Party Aggregators | Custom Peer-Group Framework |
|---|---|---|---|
Industry granularity | 15 categories | 50+ subcategories | You define the cohort |
Metric coverage | 7 core metrics | 20-50+ metrics including paid and organic | Unlimited, whatever you can source |
Normalized vs. unnormalized | Both (since 2025) | Varies by platform | Both, with custom normalization rules |
Cost | Free (included in GA4) | $199-$499/month | $0 in tools, 20-40 hours setup + 5-10 hrs/month |
Sample transparency | Anonymized opt-in pool, no cohort visibility | Platform user base, no visibility into which competitors included | Full control over every company in the set |
Best for | Directional checks, outlier detection | Mid-market with mainstream competitors | High-stakes decisions requiring precision |

How To Choose Between These Three
The honest answer depends on two variables: what the benchmarking data feeds into, and how much a wrong comparison costs your business.
If benchmarking informs quarterly board reports and general performance narratives, GA4's native feature is sufficient. The 15-category granularity is coarse, but board-level discussions rarely hinge on whether your engagement rate benchmark is off by 4%. Zero cost and zero maintenance make it the right default for teams that need directional context without dedicated analyst time.
If benchmarking drives channel budget allocation or conversion rate targets, third-party aggregators earn their subscription cost. The subcategory filtering narrows your comparison cohort enough to set meaningful targets, and the multi-metric coverage helps you identify where pages rank well but fail to convert. A $499/month SEMrush subscription pays for itself if it prevents even one quarter of misallocated spend based on a bad benchmark.
If benchmarking informs strategic bets like entering a new market, launching a product line, or restructuring your acquisition mix, build the custom framework. The 20-40 hours of setup effort amortizes quickly against six-figure decisions. The Cohort-Metric-Context model gives you a repeatable structure: match 3-8 peers on business characteristics, track both normalized and unnormalized metrics, and adjust every comparison for the contextual factors that make raw numbers misleading. This kind of analytics competitive analysis takes real investment but produces the only benchmarks you can actually defend in a strategy meeting.
Many teams end up running all three in parallel. GA4 benchmarking serves as a free always-on baseline. A third-party aggregator handles monthly performance reviews. A custom framework powers the 2-3 strategic decisions per year where precision determines the outcome. The mistake is using only one approach and assuming the context it provides is complete. Every benchmarking method hides something, and the discipline is knowing exactly what each one can't see.

Alex Chen
Alex Chen is a digital marketing strategist with over 8 years of experience helping enterprise brands and agencies scale their online presence through data-driven campaigns. He has led marketing teams at two successful SaaS startups and specializes in conversion optimization and multi-channel attribution modeling. Alex combines technical expertise with strategic thinking to deliver actionable insights for marketing professionals looking to improve their ROI.
Related Articles

The SEO Benchmarking Cadence Audit: How to Stop Tracking Vanity Metrics and Start Making Data-Driven Ranking Decisions
The benchmarking cadence audit replaces static annual metric reviews with a three-frequency system — weekly pulse checks, monthly trend analysis, quarterly strategic pivots — where each layer filters SEO KPIs through conversion impact.

The Long-Tail Comparison Content Strategy: How to Rank in Niches Where 'Obvious' Comparisons Don't Work
The standard "Tool A vs. Tool B" comparison page template breaks in specialized markets where head-to-head brand queries generate fewer than 10 monthly searches. Niche industries need a different comparison architecture.

Long-Tail Comparison SEO: Finding Uncontested Niches Before Your Competitors Do
Long-tail comparison keywords — queries containing "vs," "for [specific audience]," or "alternative to" — sit in the lowest competition bands of search while attracting decision-stage buyers.
Explore more topics