The Real-Time Analytics Stack for Marketing: Tableau vs. Power BI vs. Matomo for 2026 Performance Monitoring
Tableau's April 2026.1 release deprecated its native Marketo and Oracle Eloqua connectors while simultaneously shipping AI-generated metric alerts through Tableau Pulse. Two days later, a fresh enterprise benchmark showed Power BI rendering a 50-million-row dashboard in 1.

Tableau, Power BI, and Matomo Are No Longer Competing in the Same Category
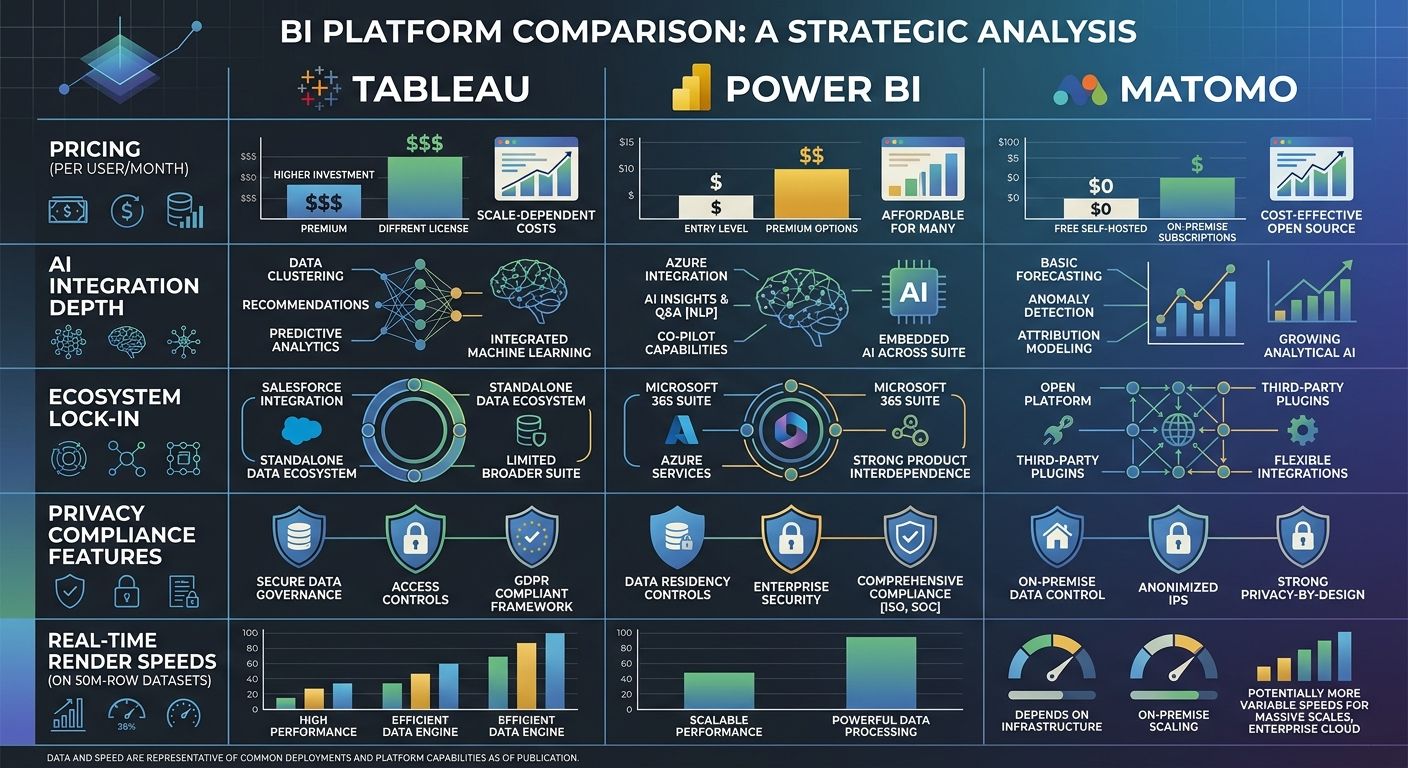
Tableau's April 2026.1 release deprecated its native Marketo and Oracle Eloqua connectors while simultaneously shipping AI-generated metric alerts through Tableau Pulse. Two days later, a fresh enterprise benchmark showed Power BI rendering a 50-million-row dashboard in 1.8 seconds on Fabric F64, edging out Tableau Cloud's 2.3 seconds on the same workload. And Matomo's latest release, version 5.9.0, shipped with a headline feature about CNIL compliance in one click and a redesigned Segment Management page. Three tools. Three entirely different strategic bets. The standard BI platform comparison — features in a spreadsheet, check the boxes, pick the cheapest winner — has become a category error for marketing teams assembling a performance monitoring stack this year.
The contrarian claim here is simple: if you're still evaluating Tableau, Power BI, and Matomo on the same rubric, you'll end up with the wrong tool. These platforms have diverged so sharply in 2026 that the decision isn't really about real-time analytics tools anymore. It's about which organizational ecosystem you're already embedded in, and which AI layer you're willing to commit your marketing data to.
I've spent the last three months helping two different enterprise clients navigate this exact decision. What follows are the three pieces of evidence that changed how I think about the 2026 marketing data dashboards landscape.
Tableau Is Now a Salesforce Intelligence Agent
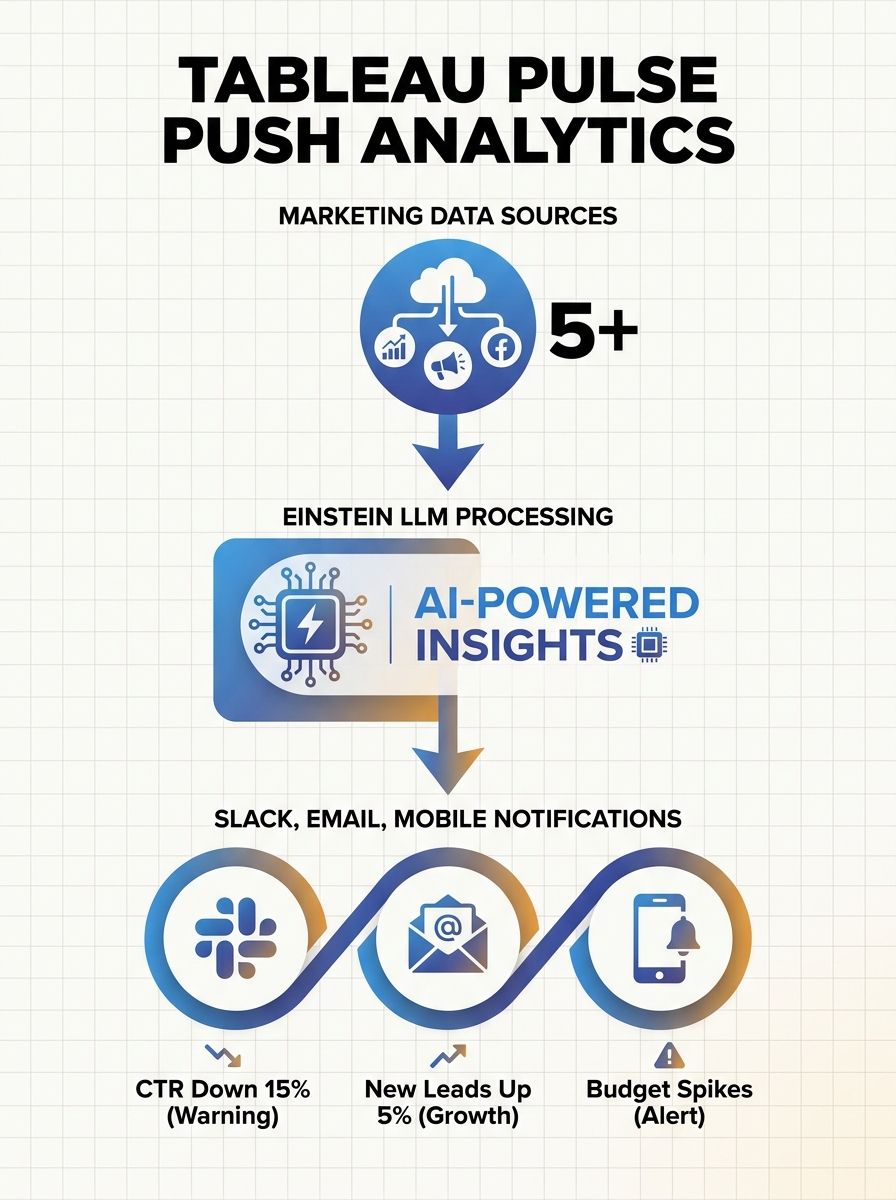
The Tableau of 2023 was a charting tool. The Tableau of 2026 is something else entirely. With Tableau Pulse generally available since early 2024 and now deeply integrated into the Salesforce ecosystem, the platform has pivoted from "build dashboards" to "receive AI-generated insights pushed to you before you ask." This is a fundamentally different interaction model for marketing teams.
Here's what that looks like in practice. Tableau Pulse uses Einstein large language models to monitor your KPIs — CAC, ROAS, conversion rates, whatever you've defined — and pushes anomaly explanations directly to Slack, email, and mobile. You don't open a dashboard. You get a notification that says your cost-per-acquisition on a specific campaign spiked 22% compared to the seven-day rolling average, along with a plain-language explanation of likely causes. Threshold tracking enables mid-campaign budget adjustments based on real-time performance against benchmarks.
The 2026.1 release added certified metrics with visual governance indicators, a REST API connector replacing the deprecated Web Data Connector (so business users can pull from ad platforms without writing code), and Tableau Next in beta, which lets users build semantic data models using natural language. If you've been debugging data quality issues in your analytics stack, Tableau's governance layer addresses part of that problem by enforcing metric consistency across teams.
But the strategic signal is in what Tableau removed. Deprecating the Marketo and Oracle Eloqua connectors in 2026.1 tells you where Salesforce sees Tableau heading: deeper into its own ecosystem, with JDBC-based alternatives available via Tableau Exchange for anyone who needs legacy connections. Tableau's real-time analytics capabilities are strong, but they're increasingly optimized for organizations already running Salesforce Data Cloud and Agentforce.
The pricing confirms this positioning. At $75 per user per month for Tableau Creator, the platform is approximately 50% more expensive than Power BI for a 100-user deployment. That premium buys you superior visual storytelling, stronger cross-platform analytics, and the Salesforce AI layer — but only if you're actually in that ecosystem.
Power BI Became Microsoft's Marketing Copilot
Power BI's trajectory mirrors Tableau's in one respect: both have stopped competing on chart types and started competing on AI integration. The difference is which AI and whose cloud.
Under Microsoft Fabric, Power BI now operates as one surface within a unified data platform. The April 2026 updates pushed Copilot deeper into the workflow: natural language queries, DAX code generation, and prompt-to-dashboard creation are all live. The Mobile Copilot preview means marketers can get AI-powered analysis on their phones while walking between meetings. And Direct Lake mode on Fabric F128+ capacity lets Power BI query Parquet files directly from OneLake without importing them, which delivers near-real-time performance on large marketing datasets without the traditional ETL bottleneck.
For campaign monitoring specifically, Power BI Pro and Premium Per User now support 48 daily scheduled refreshes. That's a refresh every 30 minutes from sources like Google Ads or Meta — not true real-time streaming, but close enough for most marketing performance monitoring workflows. When you're building a tracking stack for AI-driven search, that refresh cadence matters because the data from answer engines and AI overviews changes faster than traditional organic search signals.
The hiring market reflects the bifurcation. According to Tredence's 2026 analysis, Power BI dominates entry-level and high-volume BI hiring, while Tableau appears more frequently in senior and specialized roles focused on visual storytelling. If you're staffing a marketing analytics function, this gap matters: the talent pool for each tool skews differently in experience and cost.
Matomo Occupies a Different Market Entirely
Putting Matomo in the same comparison as Tableau and Power BI is like comparing a web analytics audit tool with a data visualization platform. They serve different functions in the marketing stack. Matomo collects behavioral data from your web properties. Tableau and Power BI visualize data from dozens or hundreds of sources. The overlap is thin.
What Matomo does well, it does very well. The platform's privacy-first positioning has become more relevant as GDPR enforcement tightens and CNIL compliance requirements grow more specific. Matomo 5.9.0's one-click CNIL compliance feature is a concrete example: French privacy law requires specific consent mechanisms and data handling, and Matomo now handles that configuration automatically. For EU-focused marketing teams, this eliminates days of compliance configuration that Google Analytics requires manual setup for.
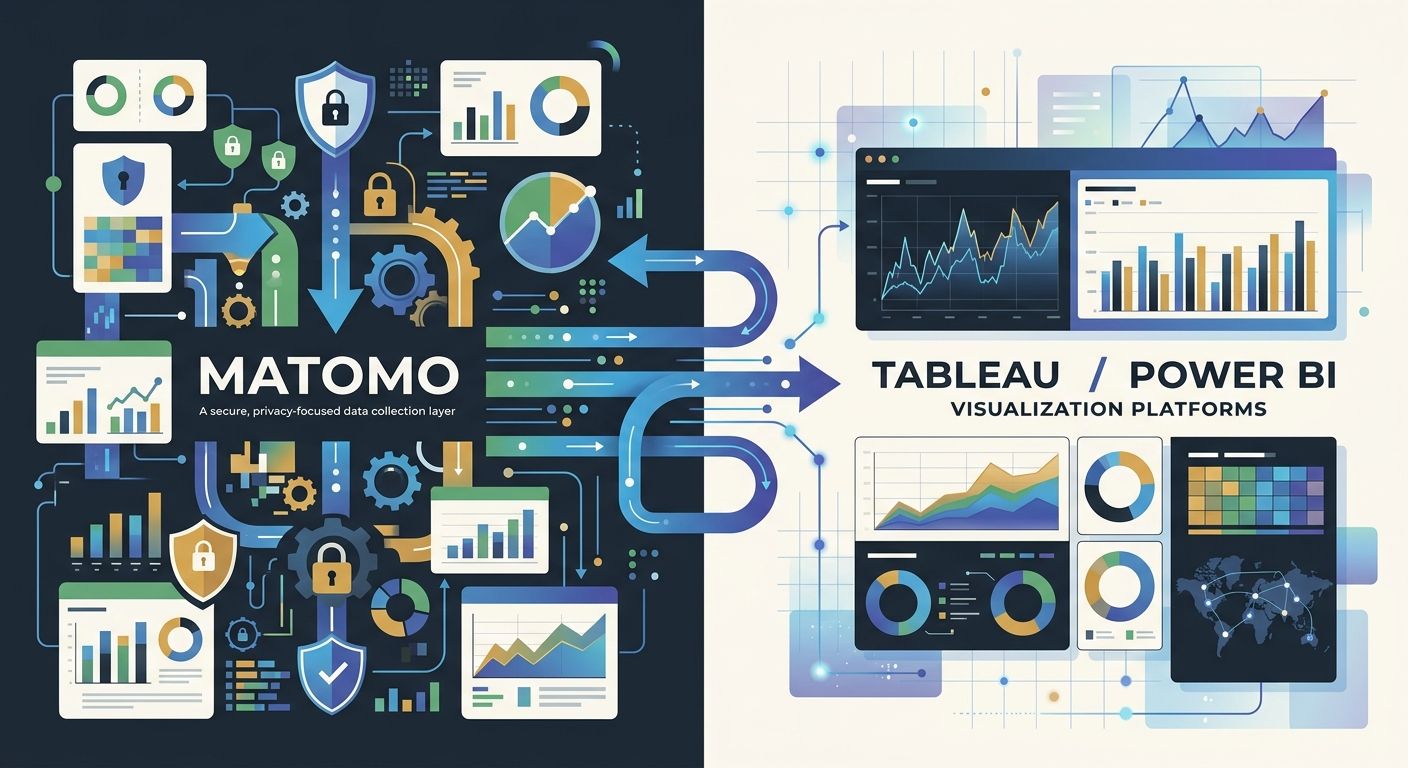
Matomo's recent rebrand, announced in late April, focused on clearer navigation, faster insights, and a more intuitive experience. These are UX improvements, not AI-agent features. And that's the point. Matomo isn't trying to become a BI platform. It's a data collection and first-party analytics layer that many organizations pair with Tableau or Power BI for the visualization and cross-channel analysis those tools provide. AgencyAnalytics offers a Matomo dashboard integration specifically for agencies that need to pull Matomo data into client-facing reports alongside data from other channels.
The pricing model reinforces the distinction. Matomo On-Premise is free and open-source. Matomo Cloud starts at a fraction of what Tableau or Power BI charge. For organizations that need clean attribution data flowing into their analytics without third-party cookie dependencies, Matomo serves as the collection mechanism — but you'll almost certainly need a separate visualization tool on top of it for serious cross-channel marketing analysis.
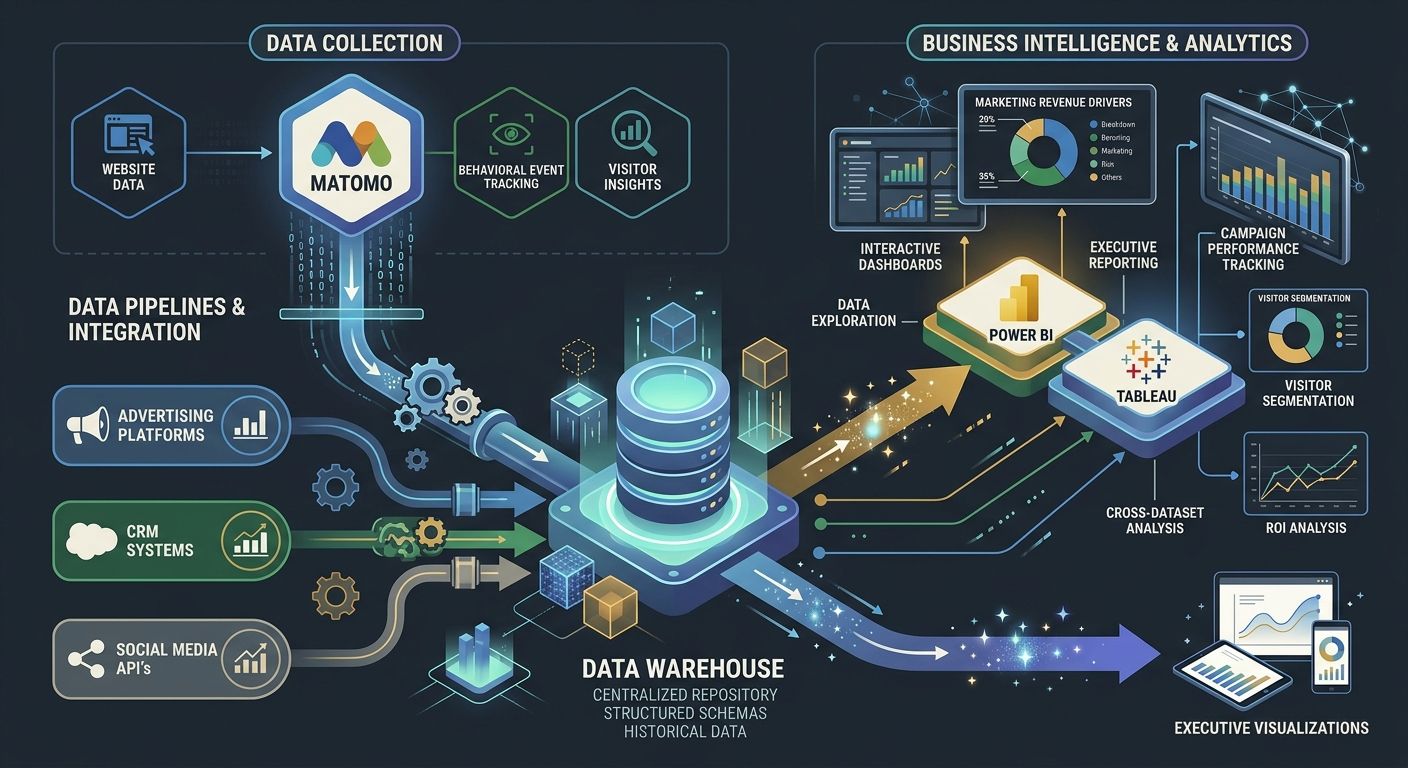
Where Matomo Fits in a 2026 Stack
The most effective pattern I've seen: Matomo handles web analytics and privacy compliance, feeding first-party behavioral data into a warehouse. Tableau or Power BI sits on top, pulling from that warehouse alongside CRM data, ad platform APIs, and whatever else your marketing org generates. Trying to use Matomo as your sole marketing data dashboard is feasible for small operations, but it hits a ceiling fast once you're managing campaigns across more than three or four channels.
The Comparison Framework That Needs Retiring
The three pieces of evidence point in the same direction. Tableau has become a Salesforce Agentforce vehicle optimized for push-based, AI-driven marketing intelligence within the Salesforce ecosystem. Power BI has become a Microsoft Copilot vehicle optimized for organizations running Microsoft 365 and Azure. Matomo has become a privacy-first data collection layer that feeds into whichever BI tool your organization prefers.
Evaluating them as interchangeable options on a feature grid produces bad decisions because the grid obscures the real question: which ecosystem does your organization already depend on?
If your CRM is Salesforce and your sales team lives in Data Cloud, Tableau gives you the tightest integration and the most capable AI layer for proactive marketing insights. If your organization runs on Microsoft 365, Teams, and Azure, Power BI offers better cost efficiency and increasingly competitive AI features through Copilot, provided you can justify the Fabric capacity pricing. And if your analytics infrastructure needs to be privacy-compliant by default, Matomo handles the data collection piece regardless of which BI tool sits downstream.
The real-time analytics tools market in 2026 hasn't converged around a single winner. It's fractured along ecosystem lines, and the fracture is accelerating as Tableau and Power BI both double down on their respective AI agent strategies. For marketing teams assembling or reassessing their performance monitoring stack, the practical framework isn't "which tool has better charts" or even "which tool is cheaper." The framework is "which AI ecosystem will govern how my team interacts with data for the next three to five years" — because that's the commitment these platforms are now asking you to make, whether the sales pitch says so or not.

Alex Chen
Alex Chen is a digital marketing strategist with over 8 years of experience helping enterprise brands and agencies scale their online presence through data-driven campaigns. He has led marketing teams at two successful SaaS startups and specializes in conversion optimization and multi-channel attribution modeling. Alex combines technical expertise with strategic thinking to deliver actionable insights for marketing professionals looking to improve their ROI.
Explore more topics