The Analytics Tool Stack Audit: Choosing Between Tableau, Power BI, and Matomo Based on Your Marketing Data Needs
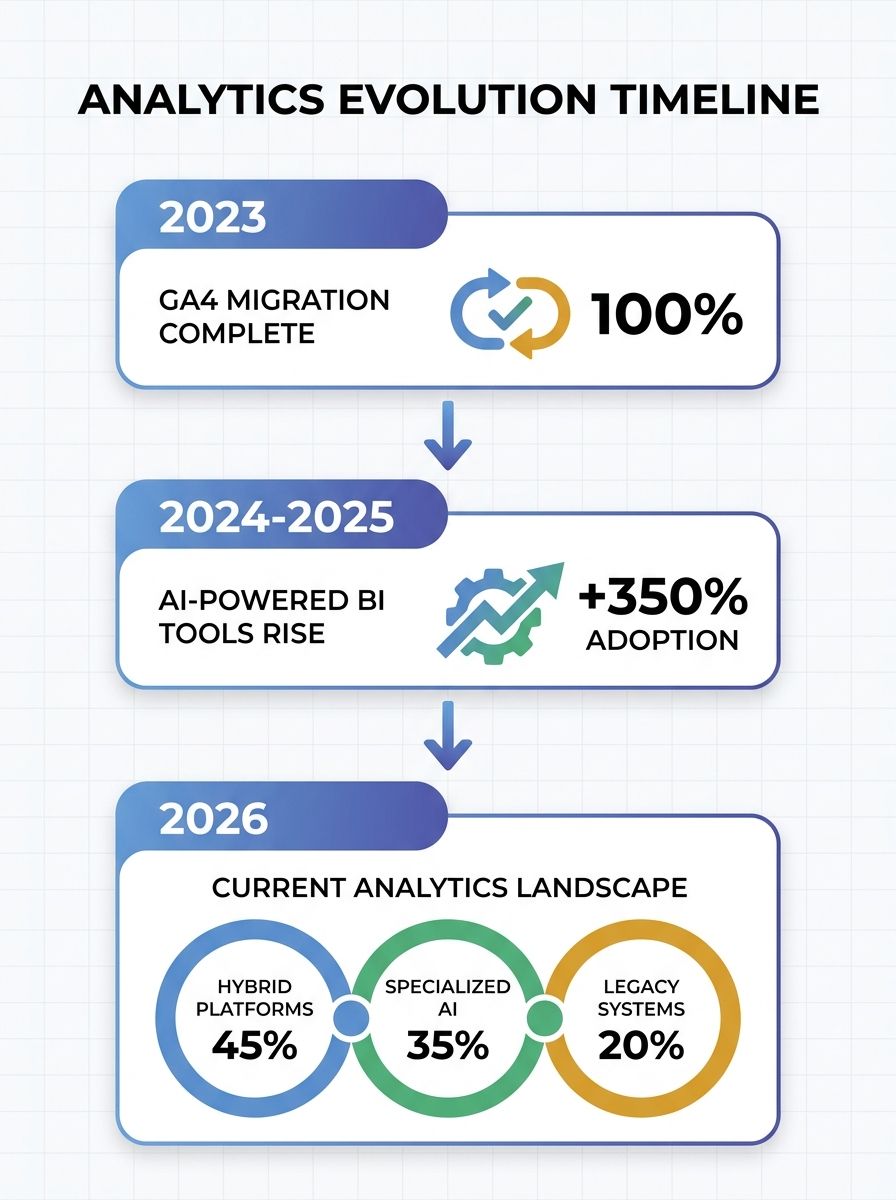
Google's shutdown of Universal Analytics in July 2023 didn't just retire a product. It detonated the default analytics stack that most marketing teams had relied on for over a decade.
The Analytics Tool Stack Audit: Choosing Between Tableau, Power BI, and Matomo Based on Your Marketing Data Needs
Google's shutdown of Universal Analytics in July 2023 didn't just retire a product. It detonated the default analytics stack that most marketing teams had relied on for over a decade. The forced migration to GA4 exposed an uncomfortable truth: most organizations had never intentionally chosen their analytics tools. They'd inherited them. And when GA4's event-based data model broke existing reports, dashboards, and attribution workflows, thousands of marketing teams started asking the right question for the first time. Not "how do I fix this?" but "should I be using something else entirely?"
That question kicked off a wave of analytics tool comparison activity that's still playing out. I've audited the marketing data infrastructure at 14 organizations over the past two years, and the same three contenders keep surfacing: Tableau, Power BI, and Matomo. Each solves a different problem. Most teams pick the wrong one.
Phase 1: The Great Unbundling Begins
The GA4 migration forced marketing teams to rebuild their reporting from scratch. But rebuilding revealed something worse than broken dashboards. It revealed that nobody owned the data.
GA4 samples data aggressively at scale. Its attribution model changed. Historical data from Universal Analytics became inaccessible. Teams that had spent years building campaign tracking around a specific platform suddenly realized they'd been renting their analytics, not owning them. If you've experienced dashboard reports that don't match actual performance, you know exactly what I mean.
This moment split the market into three camps. Enterprise teams with Salesforce contracts started evaluating Tableau. Organizations already deep in the Microsoft ecosystem looked at Power BI. And privacy-conscious teams, especially those operating under GDPR or CCPA, started seriously exploring Matomo for the first time.
Power BI Absorbs AI and Undercuts on Price
Microsoft moved fast. The integration of Copilot into Power BI through Microsoft Fabric gave the platform a genuine AI-assisted reporting layer that no competitor could match at the same price point. At $10 per user per month for the Pro license, Power BI became the obvious choice for any organization already paying for Microsoft 365.
But "obvious" and "correct" aren't the same thing.
Power BI's strengths are real. It supports DAX and M language for data manipulation, plus R and Python scripts for advanced analytics, as DataCamp's 2026 comparison details. Copilot can generate reports from natural language prompts, which dramatically lowers the barrier for marketing managers who don't write queries. And the governance model is strong if your IT team already manages Azure Active Directory.
Here's where most marketing teams get burned, though. Power BI is optimized for internal operational reporting. It's brilliant at pulling data from SQL Server, Excel, and Dynamics 365 into clean dashboards. It's less brilliant at handling the messy, multi-source reality of marketing data. Campaign data from Meta, Google Ads, email platforms, CRM touchpoints, and web analytics all need to be piped in through connectors or custom ETL pipelines. The tool itself won't solve your data integration problem. It assumes you've already solved it.
My test for whether Power BI is right for a marketing team: if 70% or more of your data already lives in the Microsoft ecosystem, go for it. If you're pulling from six different ad platforms, a separate CRM, and a standalone web analytics tool, you'll spend more time on data plumbing than on analysis.
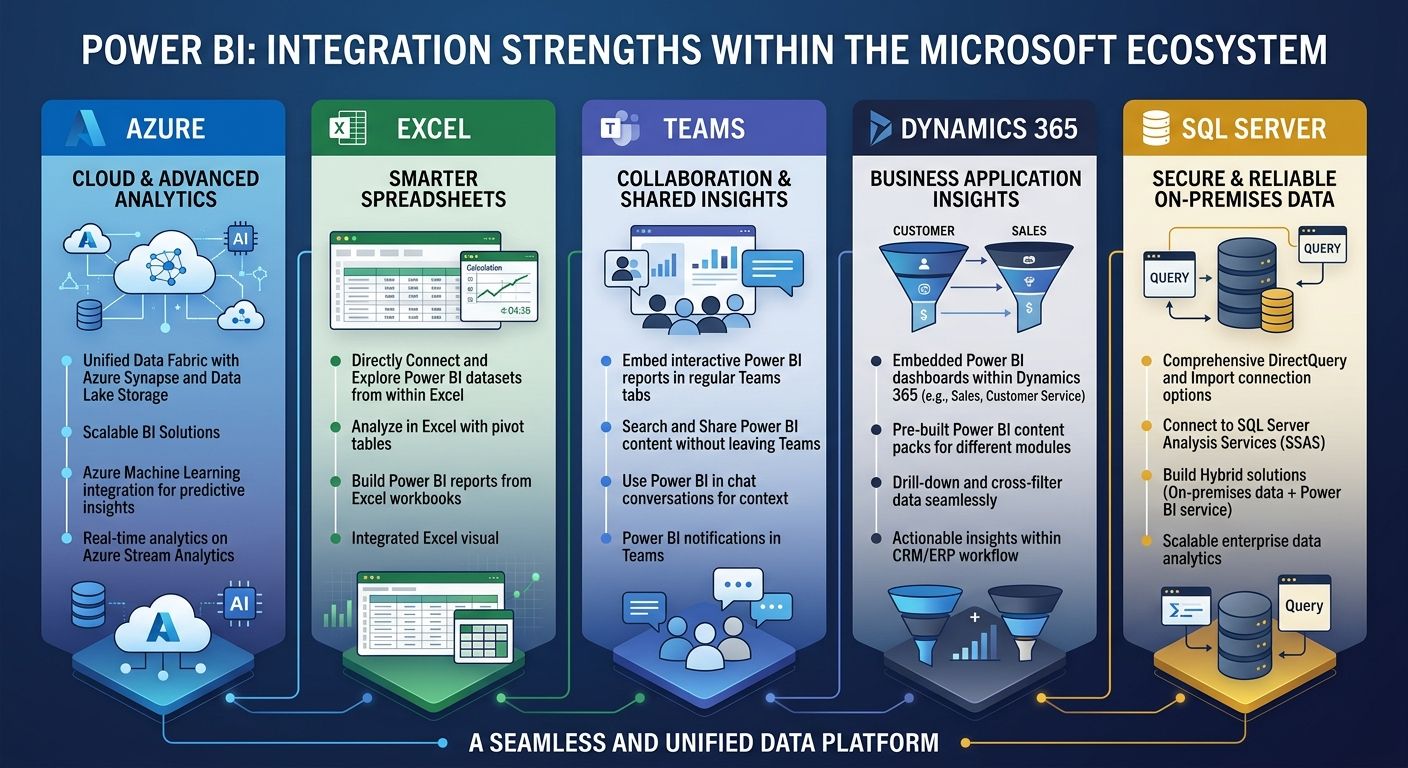
Tableau Plays the Visualization Card
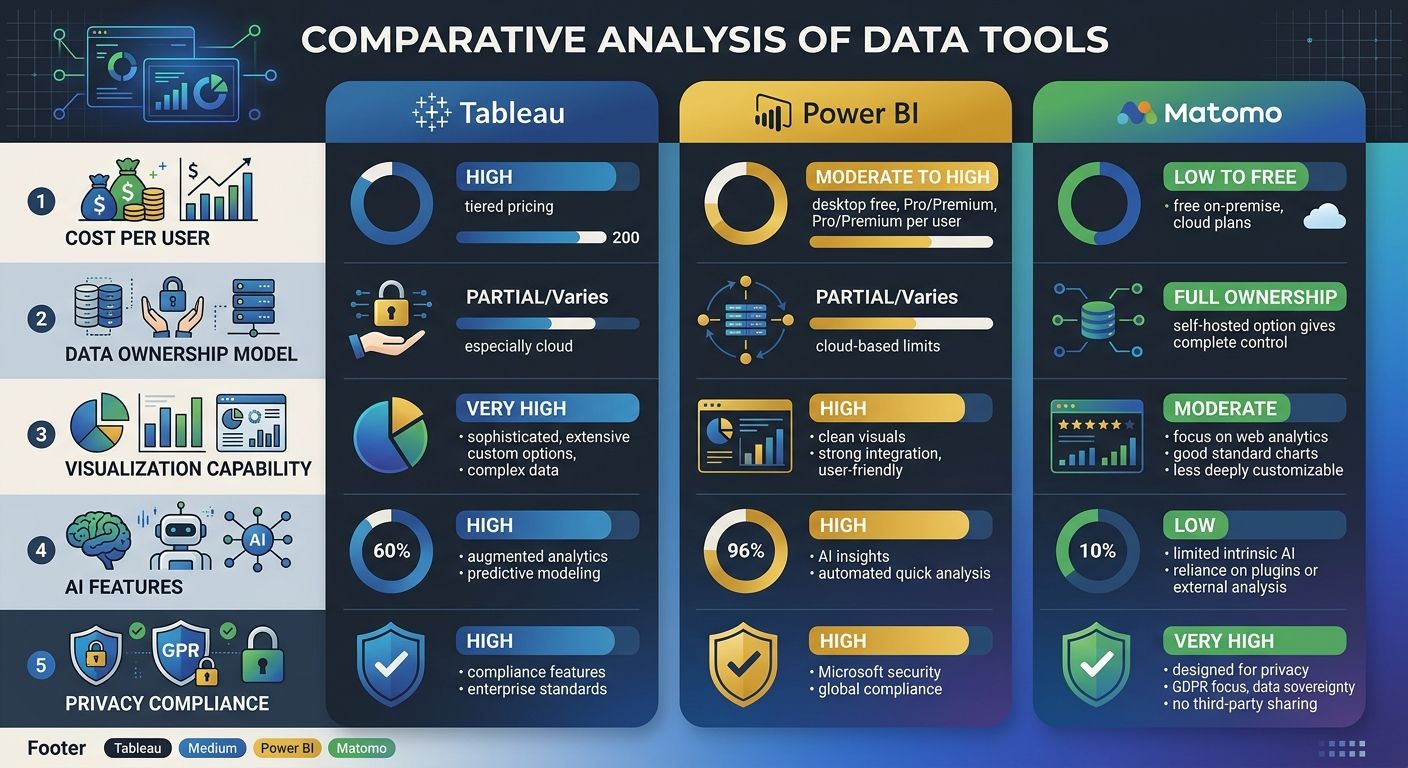
Tableau has always been the premium option. At $75 per user per month for a Creator license, it costs 7.5x what Power BI charges. That price gap is the single biggest factor in every analytics tool comparison I've conducted.
So what do you get for that money?
The honest answer: the best data visualization engine available. Tableau's drag-and-drop interface remains genuinely more intuitive than Power BI's for complex, exploratory analysis. You don't need to learn a query language to build something meaningful. Tableau Pulse, powered by Salesforce's Einstein AI, now proactively surfaces anomalies and trends without requiring manual dashboard creation. For marketing teams doing executive reporting or client-facing analytics, this visual quality matters.
Where Tableau really shines is in environments where multiple departments need to explore the same dataset from different angles. A marketing team can slice campaign data one way, a finance team can slice budget data another way, and both can work from a single source of truth. If you're trying to build cross-team workflows that actually scale, Tableau's collaborative model supports that well.
But here's my honest assessment after watching teams try to justify the price: if your primary use case is campaign performance dashboards and monthly reporting, you're overpaying. Tableau earns its premium when you need sophisticated, exploratory analytics. Most marketing teams don't. They need consistent, accurate reporting. And that's a different problem.
Matomo Rewrites the Data Ownership Rules
While Tableau and Power BI competed on visualization and AI features, Matomo quietly became the most important tool in the privacy-first analytics stack.
The value proposition is straightforward. Matomo is open-source. You install it on your own server. The data stays in your database. You own it completely, and you can access everything through Matomo's API. No sampling. No third-party data sharing. No dependency on a vendor's data retention policies.
For organizations operating under GDPR, this isn't a nice-to-have. It's a compliance requirement. As Matomo's documentation states, self-hosted deployment provides greater transparency, data ownership, and customization than proprietary alternatives like Google Analytics.
The self-hosting requirements are modest: PHP 8.1+, MySQL 8+ or MariaDB 10.4+, and at least 2 GB of RAM. For sites handling over 1 million pageviews per month, you'll want separate app and database servers. But the total cost of ownership often comes in lower than people expect, especially compared to enterprise Tableau licenses. The open-source version is free. Paid cloud plans start at $19 per month.
What Matomo doesn't do is compete with Tableau or Power BI on general-purpose business intelligence. It's a web analytics platform. It tracks visitors, sessions, campaigns, goals, and e-commerce transactions. It includes heatmaps, session recordings, and A/B testing. But it won't connect to your Salesforce instance or visualize your entire P&L. That's not the point.
The teams that benefit most from Matomo are those who need accurate, unsampled web analytics data that they fully control, and who then pipe that data into a separate BI tool for cross-channel reporting.
Building the Layered Stack
The uncomfortable truth about this analytics tool comparison is that no single platform handles everything a modern marketing team needs. The organizations I've seen get the best analytics platform ROI are running layered stacks where each tool plays a specific role.
Here's the framework I use when auditing a team's marketing data infrastructure:
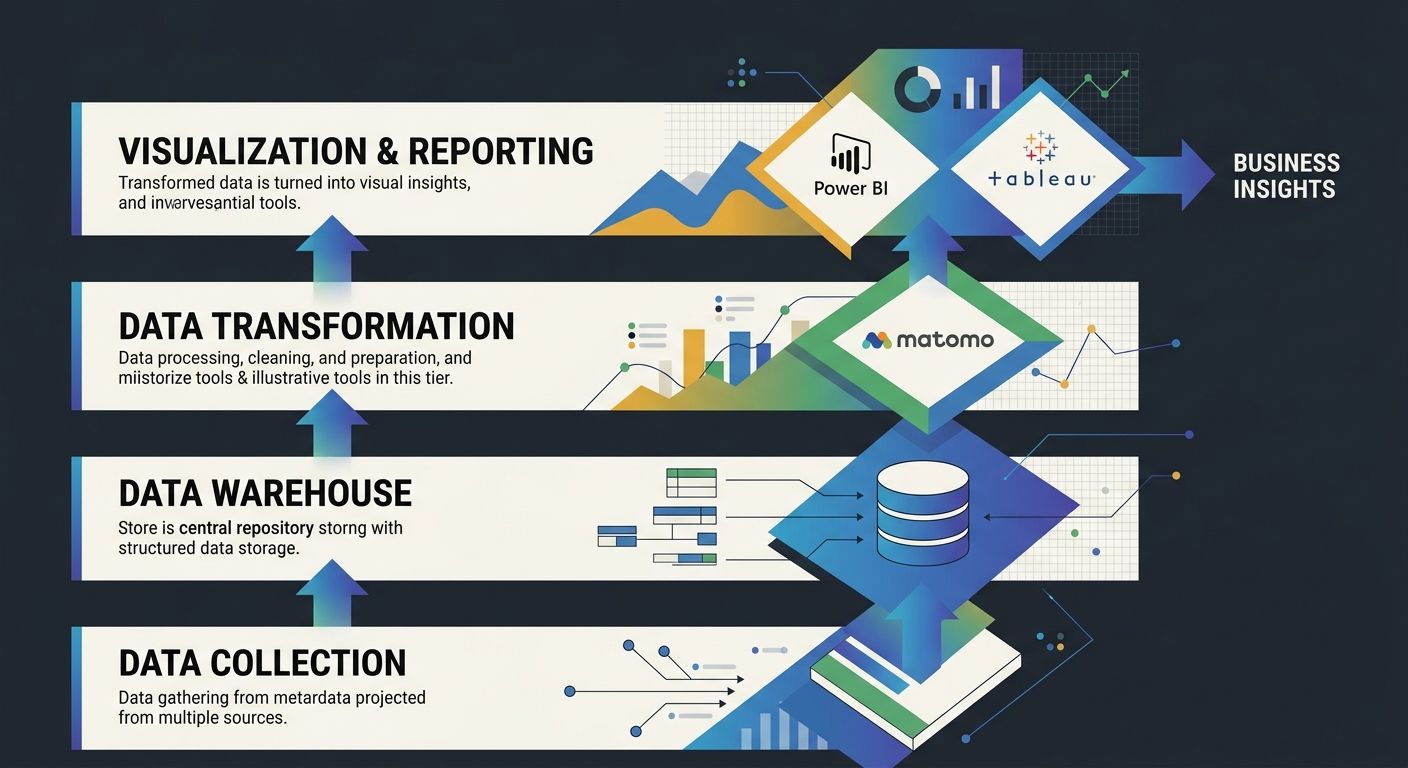
Layer 1: Data Collection. What captures the raw behavioral and transactional data? Matomo handles web analytics with full data ownership. GA4 works here too, but with the sampling and ownership tradeoffs. This layer needs to be bulletproof and privacy-compliant.
Layer 2: Data Warehouse. Where does everything get consolidated? Snowflake, BigQuery, or a self-hosted PostgreSQL instance. This is where your campaign data from ad platforms, CRM data, web analytics exports, and revenue data all converge. If you've been dealing with tool stack bloat and want an API-first approach, this is the layer to standardize first.
Layer 3: Transformation. How do you clean and model the data? dbt has become the standard here, turning raw data into analysis-ready tables.
Layer 4: Visualization and Reporting. This is where Tableau or Power BI enters. They sit on top of your warehouse and turn modeled data into dashboards, reports, and exploratory analysis. Pick Power BI if you're Microsoft-native and budget-conscious. Pick Tableau if visualization quality and cross-team exploration drive your decisions.
The teams that try to make one tool handle all four layers end up with gaps. Every single time.
When Google announced the return of Data Studio features, many teams revisited their analytics stack decisions entirely. That's healthy. The goal isn't to pick a tool forever. It's to build a stack that matches your current data maturity and grows with you.
The 90-Day Audit That Pays for Itself
If you're reading this and suspecting your current stack has gaps, here's how I'd structure the audit:
Inventory your data sources. List every platform generating marketing data. Count them. Most teams are shocked to find 8-15 distinct sources.
Map your data flow. For each source, document where the data goes, who transforms it, and where it ends up. Draw it on a whiteboard. The gaps will be visible immediately.
Test your data ownership. For each tool in your stack, answer: can you export all historical data in a portable format within 48 hours? If the answer is no, you have a vendor dependency problem.
Calculate true cost of ownership. License fees are just the start. Add the engineering hours spent on data integration, the analyst hours lost to manual report building, and the cost of decisions made on bad data. That last one is the biggest number, and it's the one nobody tracks.
Run a 30-day parallel test. Before committing to a new tool, run it alongside your current stack on a single campaign or channel. Compare the outputs. The discrepancies will tell you more than any vendor demo.
Measuring marketing ROI effectively requires multi-channel attribution models combined with analytics platforms that can track the full customer lifecycle. If your current tools can't connect ad spend to closed revenue, the audit just justified itself.
What Tool Fit Reveals About Your Organization
The feature-by-feature comparison between Tableau, Power BI, and Matomo is a trap. I've watched teams spend months debating whether Tableau's visualization engine justifies its 7.5x price premium over Power BI, while their actual problem was that they had no reliable data pipeline feeding either tool.
Start with your data. Where does it live? Who owns it? How does it flow? Then pick the tools that plug into that reality, not the tools with the most impressive demo.
Power BI at $10/user/month is the right call for Microsoft-native teams doing operational reporting. Tableau at $75/user/month earns its keep when cross-team exploration and executive-grade visualization drive business decisions. Matomo, starting at free, is non-negotiable for any organization that needs genuine data ownership in analytics and privacy compliance.
Build in layers. Test before you commit. And audit your stack at least annually, because the tool that fit your needs 18 months ago might be the tool that's holding you back today.

Alex Chen
Alex Chen is a digital marketing strategist with over 8 years of experience helping enterprise brands and agencies scale their online presence through data-driven campaigns. He has led marketing teams at two successful SaaS startups and specializes in conversion optimization and multi-channel attribution modeling. Alex combines technical expertise with strategic thinking to deliver actionable insights for marketing professionals looking to improve their ROI.
Frequently Asked Questions
- Should I use Power BI or Tableau for marketing analytics?
- Power BI at $10/user/month is ideal for Microsoft-native teams doing operational reporting, while Tableau at $75/user/month justifies its cost when cross-team exploration and executive-grade visualization are critical to your decisions. If 70% or more of your data lives in the Microsoft ecosystem, Power BI is the better choice; if you're pulling from multiple ad platforms and standalone tools, you'll spend more time on data integration with Power BI.
- What is Matomo analytics and why should I use it?
- Matomo is an open-source web analytics platform where you install it on your own server, ensuring complete data ownership with no sampling or third-party data sharing. It's essential for organizations operating under GDPR or CCPA compliance requirements, and provides full access to historical data through APIs at a starting cost of $19/month for cloud plans or free for the open-source version.
- How do I audit my marketing analytics tool stack?
- Inventory all data sources (most teams find 8-15), map your data flow to identify gaps, test your data ownership by checking if you can export all historical data within 48 hours, calculate true cost of ownership including integration and analyst hours, and run a 30-day parallel test with new tools before committing. This audit reveals vendor dependencies and integration problems that feature comparisons miss.
- What is a layered analytics stack and why do I need one?
- A layered stack assigns specific roles to different tools: Layer 1 collects raw data (Matomo or GA4), Layer 2 consolidates everything in a data warehouse (Snowflake, BigQuery, PostgreSQL), Layer 3 transforms and cleans data (using dbt), and Layer 4 handles visualization (Tableau or Power BI). No single platform handles all four layers effectively, so teams that try end up with gaps.
- Does Power BI have AI features for reporting?
- Yes, Power BI integrated Copilot through Microsoft Fabric, which can generate reports from natural language prompts and dramatically lowers the barrier for marketing managers who don't write queries. This AI-assisted reporting layer matches or exceeds competitors at Power BI's $10/user/month price point.
- Why did Google Analytics shutdown cause teams to reconsider their analytics tools?
- GA4's migration broke existing reports, dashboards, and attribution workflows while revealing that most organizations had never intentionally chosen their analytics tools—they'd inherited them. The forced rebuild exposed problems like data sampling, inaccessible historical data, and lack of true data ownership, prompting teams to ask whether they should use something else entirely.
- Can I use Matomo with other BI tools in my analytics stack?
- Yes, Matomo works best when paired with a separate BI tool like Tableau or Power BI—it provides accurate, unsampled web analytics data that you fully control, which you can then export via API and pipe into a BI platform for cross-channel reporting and visualization.
- What are the server requirements for self-hosted Matomo?
- Self-hosted Matomo requires PHP 8.1+, MySQL 8+ or MariaDB 10.4+, and at least 2 GB of RAM; for sites with over 1 million pageviews per month, you'll want separate app and database servers. The total cost of ownership often comes in lower than expected, especially compared to enterprise Tableau licenses.
Explore more topics