
HTTP Archive WordPress Performance Dashboard Shows Template Structure Without Populated Metrics
HTTP Archive published an updated Tech Report dashboard template on August 25, 2026 displaying the framework for tracking WordPress Core Web Vitals, Lighthouse scores, and page weight metrics across mobile and desktop environments, according to the HTTP Archive Tech Report interface.

HTTP Archive WordPress Performance Dashboard Shows Template Structure Without Populated Metrics
HTTP Archive published an updated Tech Report dashboard template on August 25, 2026 displaying the framework for tracking WordPress Core Web Vitals, Lighthouse scores, and page weight metrics across mobile and desktop environments, according to the HTTP Archive Tech Report interface. The dashboard structure reveals measurement categories for LCP (Largest Contentful Paint), INP (Interaction to Next Paint), and CLS (Cumulative Layout Shift), alongside Lighthouse accessibility and SEO scores, though the captured version displays placeholder values rather than populated data.
Dashboard Architecture and Metric Categories
The Tech Report interface organizes WordPress performance data into three primary sections: Core Web Vitals tracking, Lighthouse audit scores, and page weight analysis. Each section supports filtering by client type (mobile versus desktop), geographic region, and ranking tier.
The Core Web Vitals module measures the percentage of origins passing all three metrics simultaneously—LCP under 2.5 seconds, INP under 200 milliseconds, and CLS under 0.1. The dashboard also breaks down individual metric performance and offers geographic distribution analysis for identifying regional performance patterns.
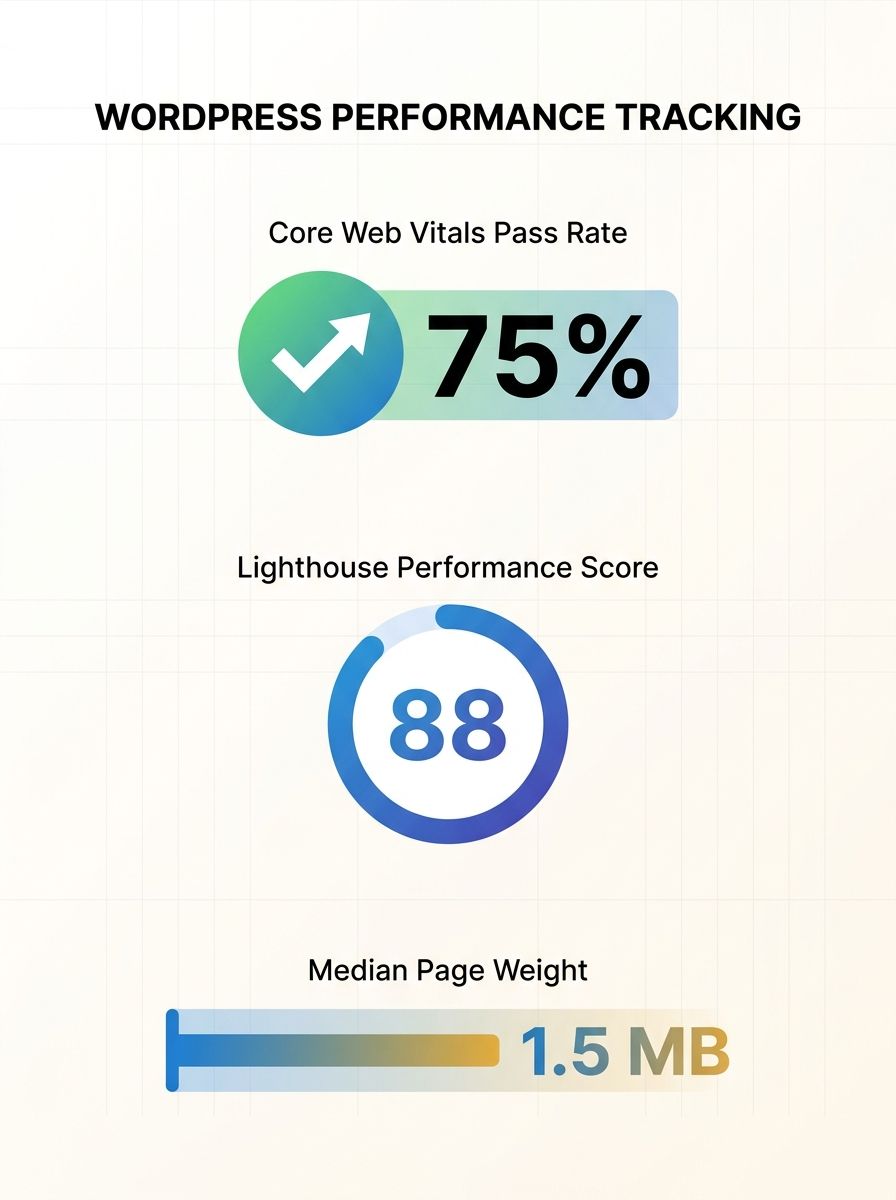
Lighthouse scoring spans four audit categories: performance, accessibility, SEO technical compliance, and best practices implementation. The interface calculates median scores across tested origins rather than averaging, reducing the influence of outlier results. Page weight tracking segments total bytes into image weight and JavaScript transfer size, both factors directly affecting page load speed and conversion rates.
Performance Monitoring Framework for SEO Teams
The dashboard's geographic breakdown feature enables SEO specialists to compare WordPress performance across markets, identifying regions where technical optimization delivers the highest impact. The histogram visualization shows how origins distribute across good, needs-improvement, and poor threshold zones for each Core Web Vital.
HTTP Archive measures performance at the 75th percentile of page loads, meaning 75% of user visits must achieve good scores for an origin to pass. This methodology aligns with Google's Core Web Vitals assessment used in search ranking calculations. The dashboard tracks temporal trends, allowing teams to measure whether WordPress performance improves or degrades over monthly crawl cycles.
The Lighthouse SEO category specifically audits technical compliance factors including meta tag implementation, structured data validity, mobile usability, and crawlability signals. These scores provide a proxy for how well WordPress configurations meet search engine technical requirements, distinct from content quality or backlink authority.
Reading Between the Lines
HTTP Archive's standardized measurement framework for WordPress creates a baseline against which marketing teams can benchmark their own installations. The dashboard architecture suggests ongoing monitoring rather than one-time assessment—the temporal tracking and geographic segmentation support continuous optimization workflows rather than isolated audits.
The separation of Core Web Vitals (real user experience data) from Lighthouse scores (lab-based testing) reflects Google's dual approach to performance evaluation. SEO teams optimizing WordPress sites need visibility into both datasets, since search ranking factors now weight actual user experience alongside technical audit scores. The dashboard's client-type filtering addresses the mobile-first indexing reality where mobile performance determines search visibility even for desktop queries.

Alex Chen
Alex Chen is a digital marketing strategist with over 8 years of experience helping enterprise brands and agencies scale their online presence through data-driven campaigns. He has led marketing teams at two successful SaaS startups and specializes in conversion optimization and multi-channel attribution modeling. Alex combines technical expertise with strategic thinking to deliver actionable insights for marketing professionals looking to improve their ROI.
Related Articles

The SEO Benchmarking Cadence Audit: How to Stop Tracking Vanity Metrics and Start Making Data-Driven Ranking Decisions
The benchmarking cadence audit replaces static annual metric reviews with a three-frequency system — weekly pulse checks, monthly trend analysis, quarterly strategic pivots — where each layer filters SEO KPIs through conversion impact.

Content Management Systems Create Measurable Search Performance Gaps Through Technical SEO Implementation Barriers
A technical SEO guide published by asclique.com on September 20 identifies specific platform architecture differences that determine whether websites can implement Core Web Vitals optimization, schema markup, and crawl efficiency controls without requiring developer intervention for each change.

Google Tightens Core Web Vitals LCP Threshold to 2.0 Seconds, Only 33% of Mobile Sites Pass
Google tightened its Largest Contentful Paint threshold from 2.5 seconds to 2.0 seconds in a March 2026 Core Web Vitals update, forcing website operators to reevaluate optimization strategies that previously passed the performance benchmark, according to a June 5, 2026 analysis published by The Visu
Explore more topics