The SEO Benchmarking Cadence Audit: How to Stop Tracking Vanity Metrics and Start Making Data-Driven Ranking Decisions
The benchmarking cadence audit replaces static annual metric reviews with a three-frequency system — weekly pulse checks, monthly trend analysis, quarterly strategic pivots — where each layer filters SEO KPIs through conversion impact.

The SEO Benchmarking Cadence Audit: How to Stop Tracking Vanity Metrics and Start Making Data-Driven Ranking Decisions
The benchmarking cadence audit replaces static annual metric reviews with a three-frequency system — weekly pulse checks, monthly trend analysis, quarterly strategic pivots — where each layer filters SEO KPIs through conversion impact. The mechanism corrects the default habit of reporting organic traffic volume as a standalone success indicator, which masks whether search visibility actually produces revenue.
Why the Default Dashboard Misleads
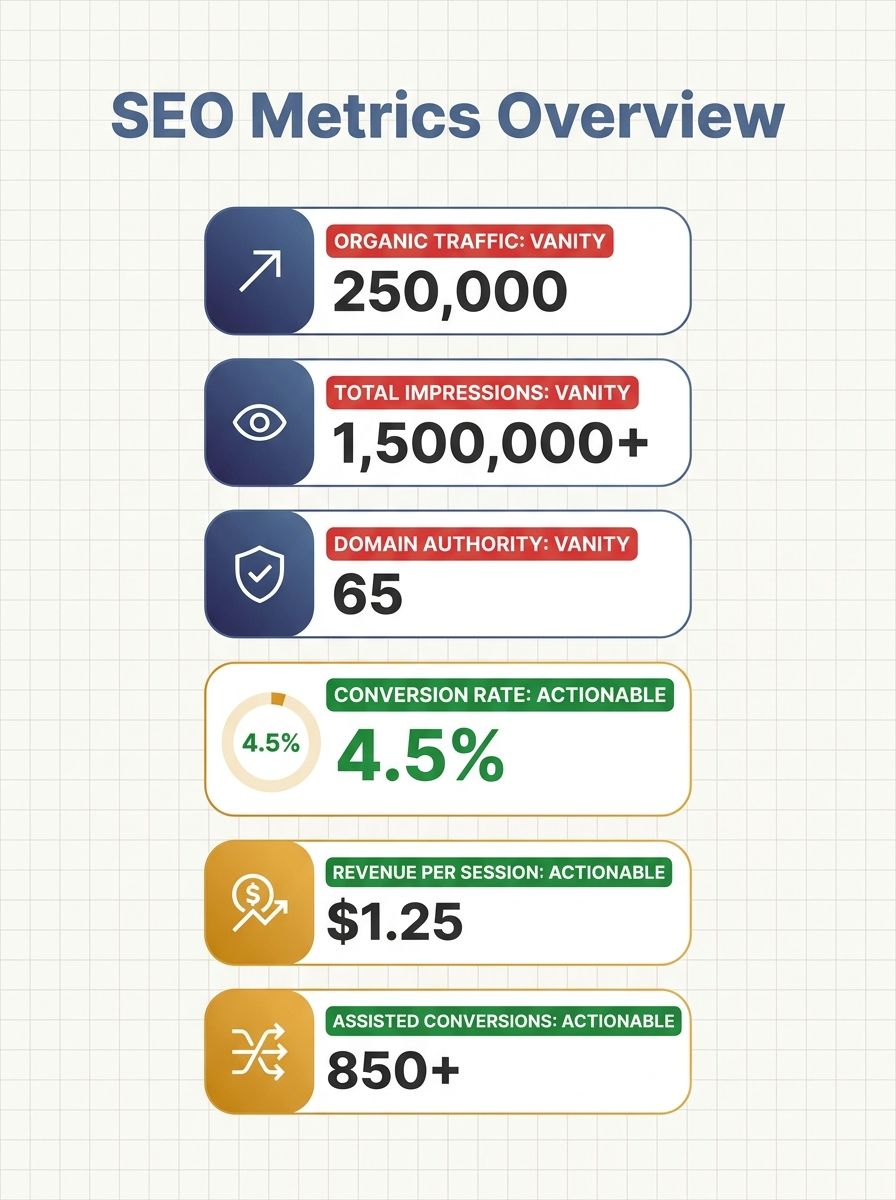
Vanity metrics are, as Tableau's analytics documentation defines them, "metrics that make you look good to others but do not help you understand your own performance in a way that informs future strategies." The definition sounds obvious. The problem is that the standard SEO dashboard is built almost entirely from these metrics.
Organic traffic volume. Total impressions. Average keyword position. Domain Authority. Total backlink count. Bounce rate. Each one looks diagnostic. Each one, in isolation, tells you almost nothing about whether your SEO program generates money.
The structural reason is that 60% of Google searches now terminate without a click, driven heavily by AI Overviews appearing in 47% of search results and compressing click-through rates from 15% to 8%. An organic traffic graph that trends upward can coexist with declining revenue from organic. A keyword ranking report showing 200 terms in the top 10 can mask the fact that 180 of those terms carry zero commercial intent.
When I've audited client reporting setups, the pattern repeats: teams track what their tools display by default, review everything monthly in one undifferentiated spreadsheet, and make no distinction between metrics that require daily attention and metrics that only reveal meaning over 90 days. The cadence audit fixes that by separating metrics into tiers based on how frequently they become decision-relevant.
The Three-Frequency Metric Stack
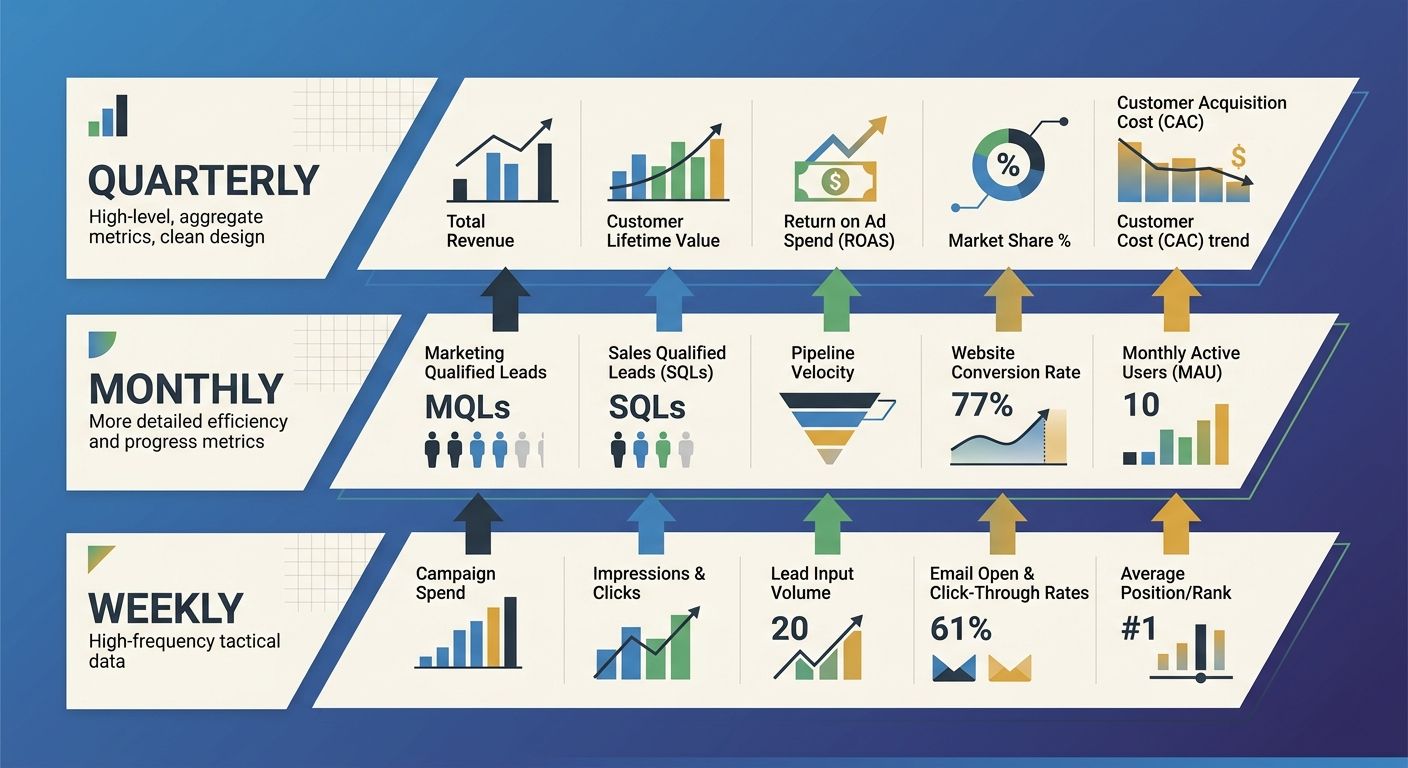
The framework I use — the Three-Frequency Metric Stack — assigns every tracked metric to one of three layers based on signal volatility and decision latency. Metrics with high daily variance and fast corrective cycles go to the weekly layer. Metrics that require 30+ days to stabilize go monthly. Metrics where strategic shifts take a full business quarter to materialize go quarterly.
The principle behind the stack: conversion-focused SEO tracking requires matching your observation window to each metric's natural cadence. Checking Core Web Vitals once a quarter misses regressions that kill conversion rates within days. Reviewing assisted conversion paths weekly generates so much noise you can't identify real patterns.
Metric | Layer | Check Frequency | Decision Type | Vanity Risk |
|---|---|---|---|---|
Organic traffic (aggregate) | Monthly | 30-day rolling | Trend validation | High without segmentation |
Core Web Vitals (LCP, CLS, INP) | Weekly | 7-day rolling | Technical fix trigger | Low |
Keyword rankings (top 20) | Monthly | 30-day average | Content optimization signal | Medium without intent weighting |
Organic conversion rate | Monthly | 30-day window | Page-level CRO decisions | Low |
Revenue per organic session | Quarterly | 90-day cohort | Strategy validation | Low |
Engaged sessions per page | Weekly | 7-day snapshot | Content quality signal | Medium |
Assisted conversions from organic | Quarterly | 90-day attribution | Channel investment decisions | Low |
Domain Authority / Domain Rating | Never tracked | N/A | N/A | Extremely high |
That last row is deliberate. Domain Authority, as AgencyAnalytics notes, "is not a direct Google signal" — Moz developed it, and while Majestic measures a related metric called trust flow, neither score appears in Google's ranking algorithm. Tracking DA month over month wastes reporting space and creates false confidence. I've removed it from every client dashboard I manage.
Weekly Pulse Metrics and Technical Decay Detection
The weekly layer catches two categories of problems: technical regressions that damage user experience and engagement drops that signal content-intent misalignment. Both degrade conversion rates faster than monthly reviews can detect.
Google Core Web Vitals benchmarks sit at the center of the weekly layer. Rakuten 24's A/B test, documented in Google's official web.dev case studies, found that achieving good Largest Contentful Paint scores produced a 53.37% increase in revenue per visitor and a 33.13% increase in conversion rate. Those numbers are large enough that a single week of LCP regression can measurably reduce revenue before a monthly dashboard catches it.
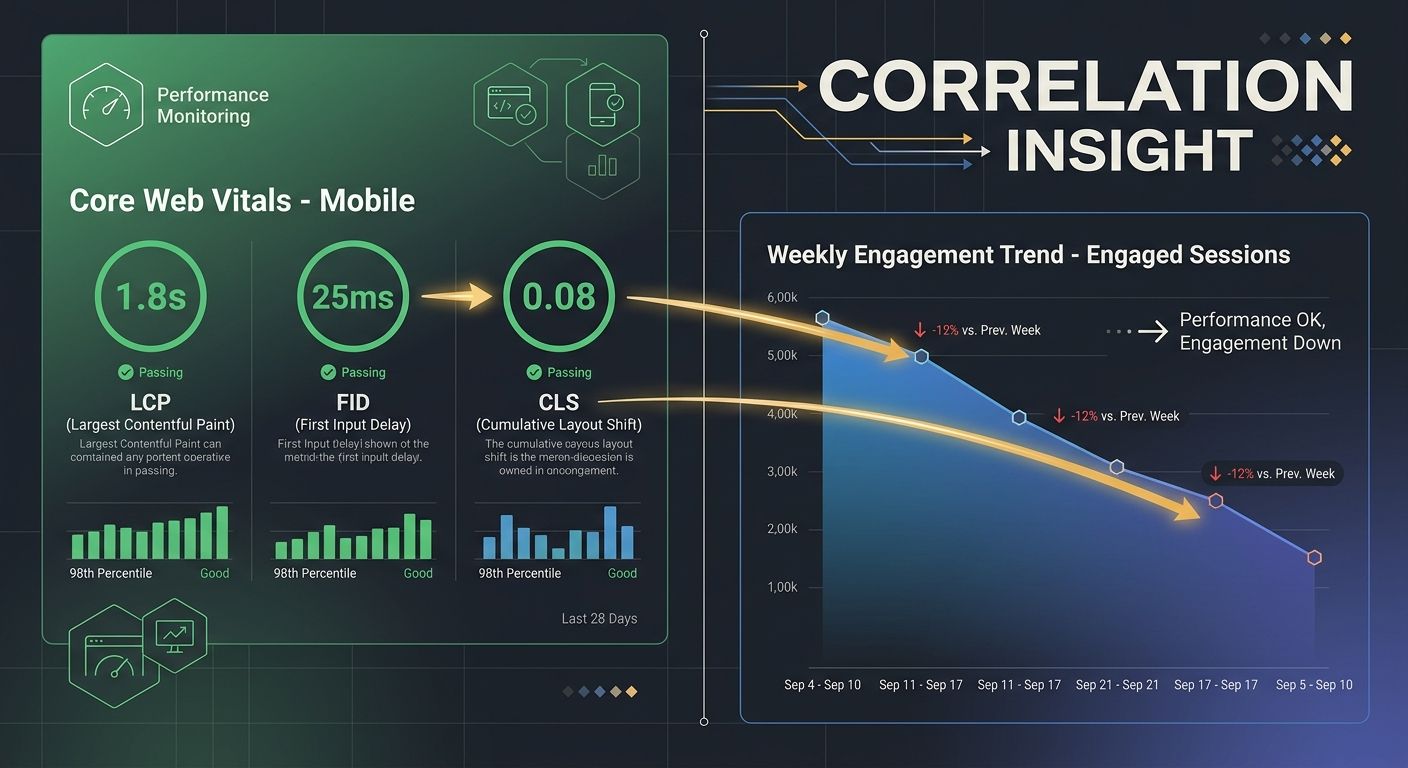
The three CWV signals to track weekly:
Largest Contentful Paint (LCP): Target under 2.5 seconds. Regression past 4.0 seconds triggers immediate investigation.
Cumulative Layout Shift (CLS): Target under 0.1. Pop-ups and late-loading ad units are the most common culprits.
Interaction to Next Paint (INP): Target under 200 milliseconds. JavaScript-heavy pages degrade this metric fastest.
If you've been diagnosing technical issues through a triage system, weekly CWV tracking tells you when new problems enter the queue. The weekly cadence matters because Portent's analysis found that Core Web Vitals have "no discernable impact on traffic" — meaning you won't see a traffic drop as your early warning signal. You'll see a conversion rate drop instead, which only shows up if you're looking at conversion-focused SEO tracking alongside vitals data in the same weekly view.
Engaged sessions per page is the second weekly pulse metric. SEO analyst Kayla Rose Hall argues in her 2026 metrics framework that "engaged sessions, return visitors, and assisted conversions provide stronger insight into content quality and business impact than rankings alone." A page that ranks #3 but shows declining engaged sessions over two consecutive weeks is a page losing relevance to its audience — and that engagement decay predicts ranking drops by 2–4 weeks in my experience across enterprise accounts.
Monthly Trend Analysis Tied to Revenue
Monthly is where the SEO metrics that matter 2026 actually reveal their patterns. Weekly data for conversion rates bounces around too much — sample sizes on most pages need 30 days to reach statistical significance.
The monthly layer tracks four metrics:
Organic conversion rate by page template. Not the site-wide average, which hides the gap between your high-performing product pages (often 3–5% conversion) and your blog content (often 0.2–0.5%). Segment by template type to find which page architectures convert and which don't. This connects directly to aligning content with search intent, because a blog post ranking for a commercial query will always convert poorly regardless of its traffic volume.
Revenue per organic session. Divide total revenue attributed to organic by total organic sessions. Track the 30-day rolling number. When this trends down while traffic trends up, you're attracting the wrong audience — a classic sign that keyword targeting has drifted toward informational terms that pad traffic reports but don't sell anything.
Top-converting page performance. Identify your top 15 pages by conversion volume. Track their ranking positions, traffic, and conversion rate as a group. These pages are your revenue engine. A position drop on page 14 of your site matters more than a position gain on page 700.
Soft vs. hard conversion split. Soft conversions — newsletter signups, content downloads, account creations — indicate positive engagement without immediate revenue impact. Hard conversions demonstrate purchase intent. As Victorious's conversion tracking guide distinguishes, the split between the two determines whether your organic channel is building pipeline or closing deals. Monthly tracking reveals whether the ratio shifts over time, which signals funnel health independent of raw traffic numbers.
For teams already running a structured benchmarking cadence, the monthly layer is where you'll spend the most analytical time. The weekly layer is operational (fix broken things). The monthly layer is diagnostic (understand what's changing and why).
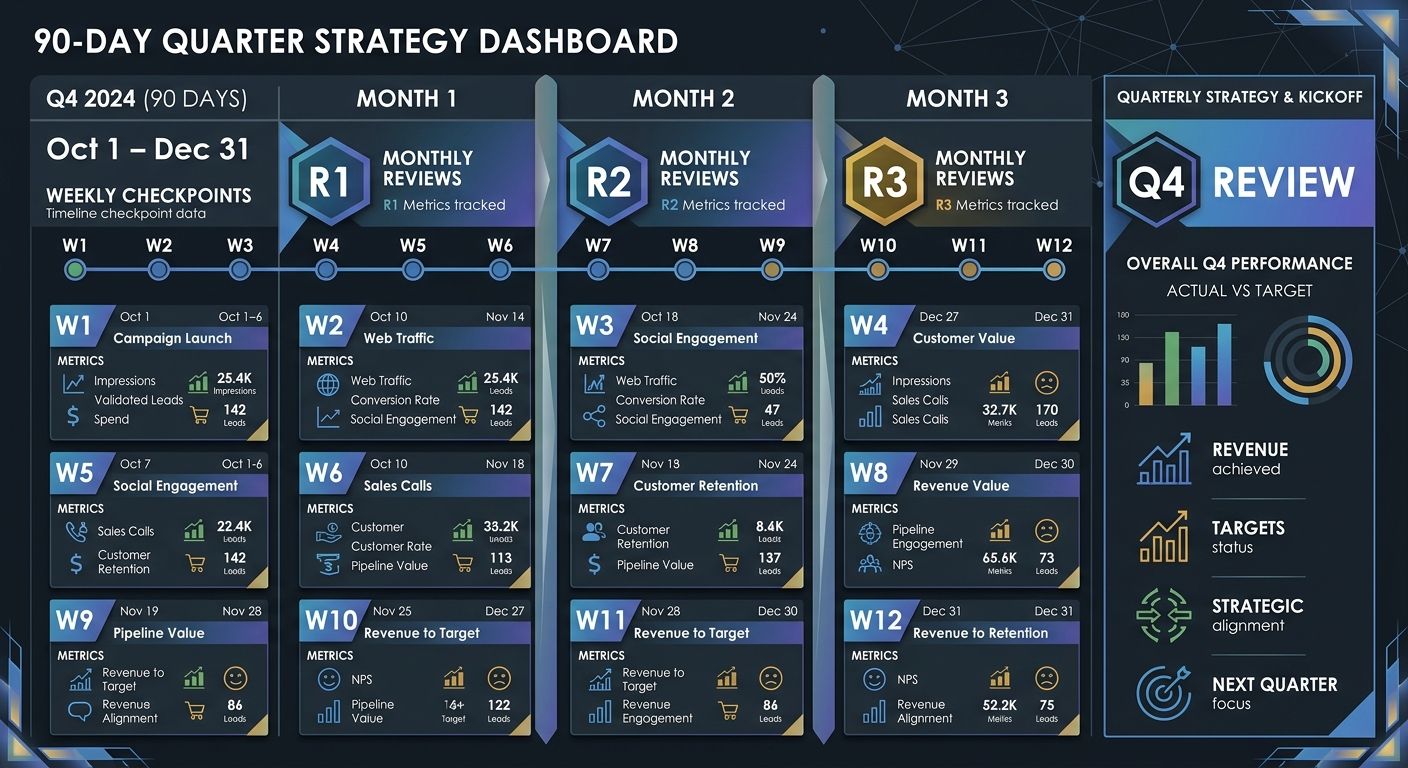
Quarterly Pivots That Reshape Strategy
Quarterly is the strategic layer. Three metrics live here because they require 90 days of data to produce stable signals.
Revenue attribution by topic cluster. Group your pages by topic cluster and calculate total attributed revenue per cluster. This reveals which subject areas generate money and which generate impressions. I've watched teams invest 6 months of content production into topic clusters that produced 40% of their organic traffic and 3% of their organic revenue — a misallocation invisible without quarterly cluster-level attribution.
AI platform visibility. With AI Overviews appearing in 47% of searches and reducing traditional CTRs, quarterly tracking of your brand's citation rate across ChatGPT, Perplexity, and Google AI Overviews is now essential. Test 50–100 relevant prompts and record whether your content appears, gets cited, or gets summarized. Teams following dual-engine visibility strategies track this as a leading indicator of organic traffic shifts 6–12 months out.
Conversion-weighted visibility score. This is the metric that replaces "how many keywords are we ranking for" with "how much business value do our rankings represent." Assign each tracked keyword a business value score based on its historical conversion rate, multiply by position-weighted impression share, and sum across your keyword set. A 15% drop in tracked keywords that coincides with a 5% increase in conversion-weighted visibility means your SEO program is getting sharper, not weaker. This is the single most important number for connecting SEO performance to business outcomes.
Organizations typically see actionable insights from the Three-Frequency Metric Stack within 4–6 weeks of implementation, with the quarterly layer producing its first complete dataset at the 90-day mark.
Where the Model Breaks
The Three-Frequency Metric Stack assumes three things that aren't always true, and ignoring its failure modes leads to false confidence in the wrong direction.
Assumption one: your site generates enough conversion volume for monthly segmentation to work. Sites with fewer than 500 organic conversions per month will find that segmenting by page template produces sample sizes too small for reliable trend detection. The fix is to aggregate up — use site-wide conversion rate at the monthly layer and push template-level segmentation to quarterly. Forcing monthly granularity on thin data creates phantom trends.
Assumption two: your attribution model captures organic's full contribution. Most GA4 installations default to last-click attribution, which undervalues organic's role in multi-touch journeys. Assisted conversions partially solve this, but teams running last-click attribution models will systematically undercount organic's quarterly revenue contribution by 20–40%, depending on sales cycle length.
Assumption three: Core Web Vitals regressions will surface in field data within a week. For lower-traffic sites (under 10,000 daily sessions), Chrome User Experience Report data updates too slowly. Weekly CWV checks on these sites should rely on synthetic monitoring tools like Lighthouse CI or WebPageTest scheduled runs rather than CrUX field data, which may lag by 28 days.
The model also doesn't account for seasonality without manual adjustment. E-commerce sites with strong Q4 spikes will see quarterly revenue-per-session numbers that oscillate wildly. Build season-over-season comparisons (Q2 2026 vs. Q2 2025) rather than sequential quarter comparisons for these businesses, or the strategic layer generates misleading pivot signals every January and July.
The uncomfortable truth about any benchmarking framework is that it works best when it tells you to stop doing something your team enjoys reporting. If your monthly review still includes a Domain Authority trend line because it makes the slide deck look favorable, the cadence audit hasn't actually taken hold. The mechanism works by filtering out the metrics that feel good and keeping the ones that connect to money — and that filtering process requires genuine willingness to report worse-looking numbers that carry actual meaning.
Sarah Chen is a Senior SEO Strategist & Analytics Consultant with 10+ years of enterprise SEO experience. She holds Google Analytics Individual Qualification (IQ) and Google Search Console certifications.

Sarah Chen
SEO strategist and web analytics expert with over 10 years of experience helping businesses improve their organic search visibility. Sarah covers keyword tracking, site audits, and data-driven growth strategies.
Related Articles

The SEO Benchmarking Cadence: Why Weekly Tracking, Monthly Reviews, and Quarterly Pivots Beat Static Annual Audits
Google's March 2026 core update reshuffled 79.5% of top-three search positions in under two weeks. Paid search teams scrambled to adjust bids while SEO teams running annual audit cycles had no framework to diagnose what happened, let alone respond.

From Blue Links to Business Outcomes: Rebuilding Your SEO Strategy Around First-Party Data in 2026
Businesses using first-party data for marketing measurement saw a 2.9x increase in revenue lift compared to those relying on third-party tracking, per Google's aggregate advertiser data. That gap keeps widening as cookie deprecation accelerates.

The SEO Mistake Triage System: Diagnosing Root Causes Instead of Treating Symptoms
Automated SEO audit tools flag hundreds of issues per crawl but assign equal visual severity to missing alt text and accidental noindex tags on revenue pages.
Explore more topics