Google Tightens Core Web Vitals LCP Threshold to 2.0 Seconds, Only 33% of Mobile Sites Pass
Google tightened its Largest Contentful Paint threshold from 2.5 seconds to 2.0 seconds in a March 2026 Core Web Vitals update, forcing website operators to reevaluate optimization strategies that previously passed the performance benchmark, according to a June 5, 2026 analysis published by The Visu
Google Tightens Core Web Vitals LCP Threshold to 2.0 Seconds, Only 33% of Mobile Sites Pass
Google tightened its Largest Contentful Paint threshold from 2.5 seconds to 2.0 seconds in a March 2026 Core Web Vitals update, forcing website operators to reevaluate optimization strategies that previously passed the performance benchmark, according to a June 5, 2026 analysis published by The Visual Communication Guy. Only 33% of websites currently pass all three Core Web Vitals metrics on mobile devices.
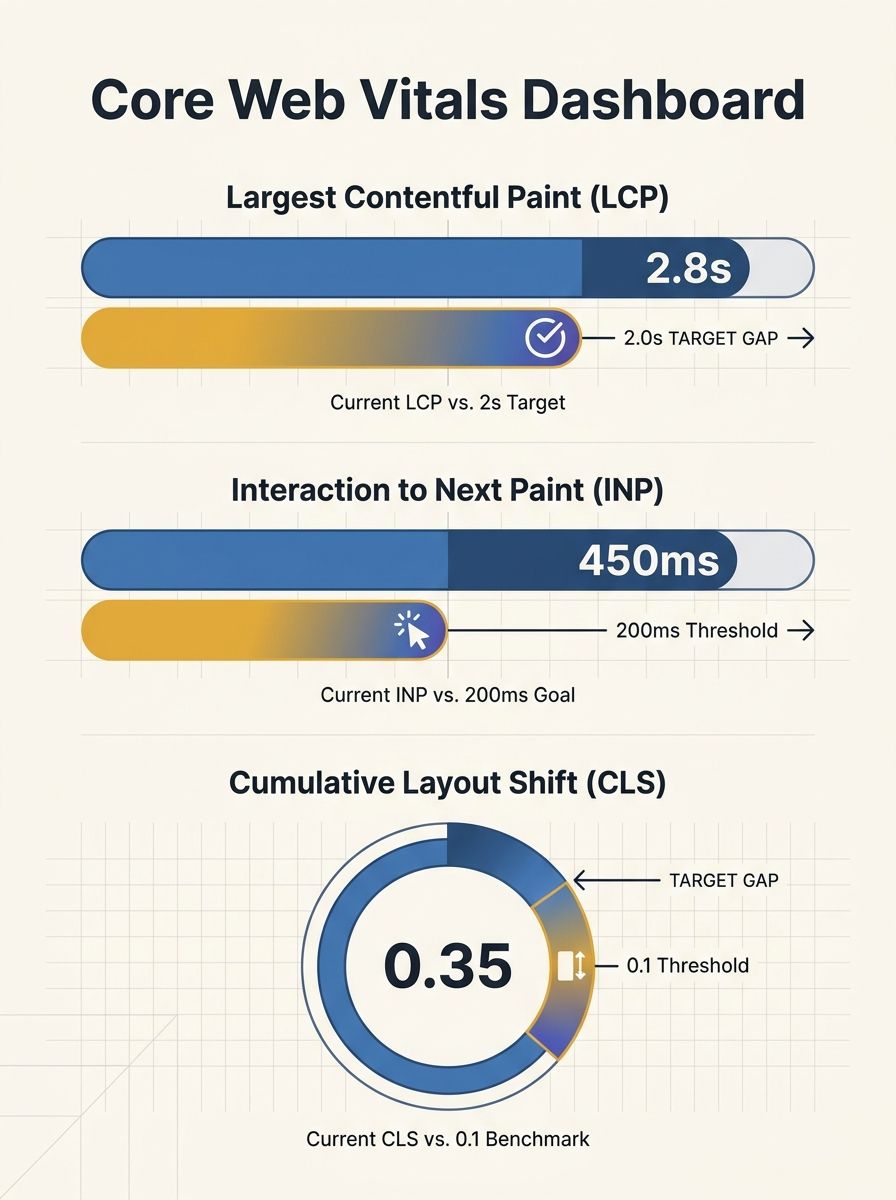
The threshold adjustment marks the first tightening of Core Web Vitals benchmarks since Google introduced the ranking factor in 2021. The new 2.0-second target applies to the Largest Contentful Paint metric, which measures how quickly the main content element becomes visible to users. Sites that achieved "good" status under the previous 2.5-second threshold now fall into "needs improvement" territory unless operators implement additional performance optimizations.
Performance Gap Widens as Mobile Pass Rate Remains Below 35%
The 33% mobile pass rate indicates that 67% of websites fail to meet at least one of the three Core Web Vitals thresholds simultaneously. The analysis identified image optimization, JavaScript execution, and server response time as the three primary technical barriers preventing sites from achieving passing scores across all metrics.
Modern image formats deliver measurable load-time reductions compared to legacy formats. AVIF files compress approximately 65% smaller than JPEG images at equivalent visual quality, while WebP formats achieve roughly 50% size reduction, according to the analysis. Sites that converted hero images from 2MB JPEG files to compressed next-generation formats reported LCP improvements of multiple seconds in field testing.
Content delivery networks reduce latency by serving cached assets from geographically distributed edge servers rather than forcing requests to travel to a single origin server. The analysis noted that visitors accessing content from Tokyo load assets from local edge nodes instead of retrieving files from servers in distant regions like North America, cutting hundreds of milliseconds from Time to First Byte measurements.
JavaScript Execution Dominates INP Performance Issues
Interaction to Next Paint scores suffer most from excessive JavaScript execution blocking the browser's main thread. The analysis found that modern websites routinely load hundreds of kilobytes of JavaScript code, much of which serves tracking pixels, A/B testing frameworks, chat widgets, and advertising scripts that provide minimal value to visitors.
Sites achieving "good" INP ratings kept worst-case interaction latency under 200 milliseconds, meeting Google's 2026 target. The analysis recommended aiming for 150-millisecond thresholds to maintain buffer against potential future benchmark tightening.
Cumulative Layout Shift measurements track visual stability as pages load. The 0.1 CLS threshold has remained unchanged through successive Core Web Vitals updates, making it one of the more stable metrics in Google's page experience framework. Late-loading banner advertisements and custom web fonts without size-adjusted fallbacks generate the majority of layout shift penalties.
Server Response Time Sets Performance Ceiling
Time to First Byte establishes the baseline for all subsequent performance metrics. Sites with TTFB measurements under 200 milliseconds have 2.1 times more indexed pages than sites with TTFB exceeding 1 second, according to data cited in the analysis. Shared hosting environments routinely produce TTFB measurements between 600 and 800 milliseconds, making passing LCP thresholds nearly impossible regardless of front-end optimization efforts.
The analysis emphasized that laboratory testing tools like Lighthouse can produce misleading results when run on high-performance development machines with fast network connections. Real User Monitoring data captures actual performance experienced by visitors across varied devices and network conditions. Google Search Console pulls field data from the Chrome User Experience Report using a rolling 28-day measurement window, meaning optimization changes require four to six weeks to fully reflect in official Core Web Vitals assessments.
Organizations tracking site architecture for SEO face compounding challenges when poor technical performance undermines content strategy execution. Similarly, operators managing domain migrations must account for Core Web Vitals performance alongside traditional 301 redirect strategies to preserve rankings during consolidation projects.
Why This Matters Now
The March 2026 threshold tightening creates immediate competitive pressure for marketing teams and SEO specialists whose sites previously met Core Web Vitals benchmarks. The 20% reduction in acceptable LCP duration means organizations cannot rely on past optimization work to maintain current search visibility. Sites that barely passed the 2.5-second threshold now fall into "needs improvement" classification, potentially impacting rankings in competitive search verticals where multiple sites compete with similar content quality.
The 67% failure rate across mobile websites suggests widespread technical debt that many organizations have deferred addressing. As Google continues refining page experience signals, the performance gap between optimized and unoptimized sites will widen, creating ranking advantages for early movers who implement server upgrades, image compression workflows, and JavaScript reduction strategies before competitors respond to the tightened benchmarks.
The four-to-six-week lag between implementing performance fixes and seeing reflected scores in Search Console means immediate action determines whether sites maintain or lose search visibility through the June-July 2026 ranking period. Organizations that delay optimization work until official scores update will trail competitors by multiple ranking cycles.

Sarah Chen
SEO strategist and web analytics expert with over 10 years of experience helping businesses improve their organic search visibility. Sarah covers keyword tracking, site audits, and data-driven growth strategies.
Related Articles
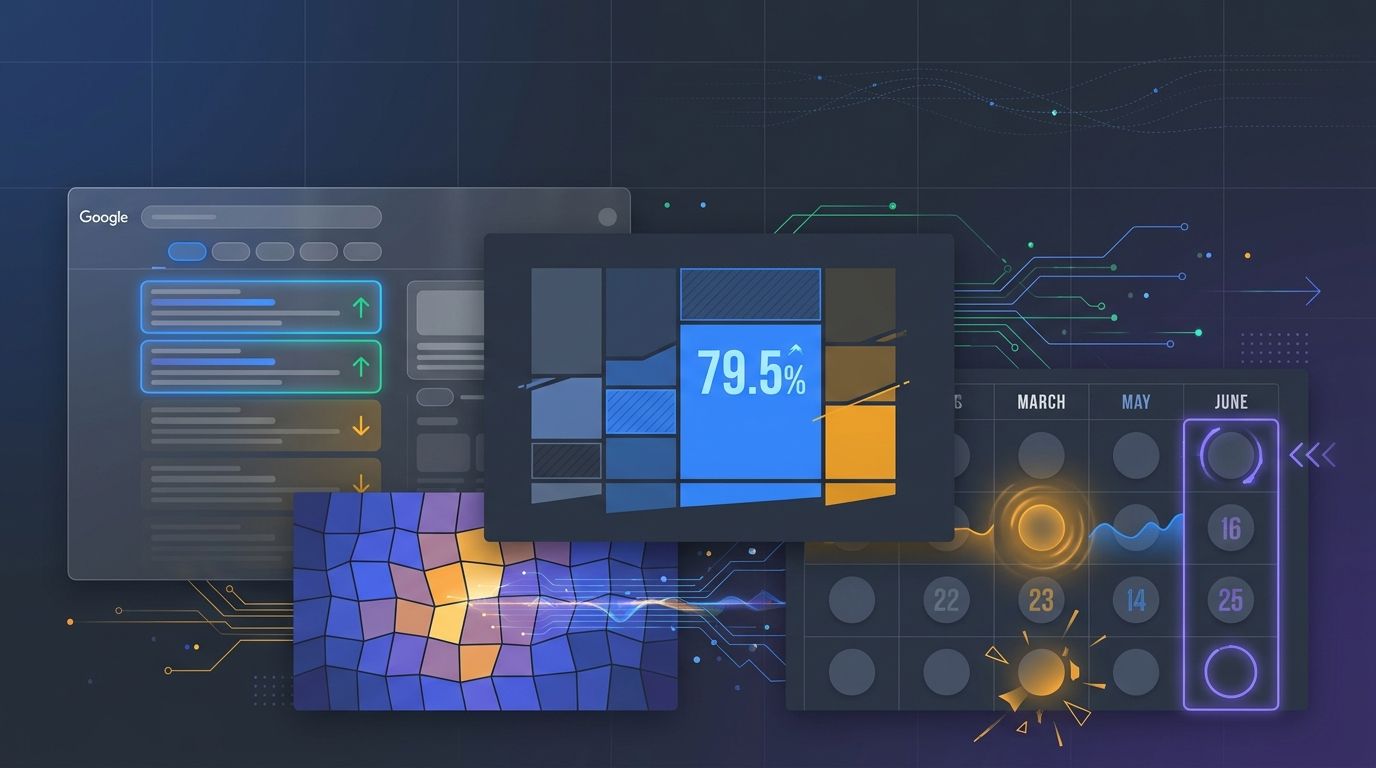
Google March 2026 Core Update Shifted 79.5% of Top-Three Search Results, SE Ranking Data Shows
Nearly four in five URLs ranking in Google's top-three positions changed during the March 2026 Core Update, according to volatility data published by SE Ranking on June 7, 2026. The 79.5% shift rate marks the highest positional volatility Google has produced in years, exceeding the 66.8% movement re

Beyond Crawlability: Why Google Understands Your Pages But Refuses to Rank Them in 2026
Crawlability has been a solved problem on most commercial websites for years, and yet Google's March 2026 core update still hit 55% of tracked sites with traffic drops averaging 20 to 35 percent. The pages affected were already indexed, already rendering, already discoverable.
Ranking #1 on Google Now Delivers 58% Fewer Clicks Than It Used To, Gravitate Analysis Finds
First-position organic search results on Google now generate 58% fewer clicks when AI Overviews appear on the page compared to traditional search results, according to an analysis released July 9 by Gravitate, a Vancouver-based digital marketing agency.
Explore more topics