The Keyword Prioritization Matrix: Building Your SEO Roadmap With Search Intent, Volume, and Business Impact
Google's quality rater guidelines define eight granular search intent classifications that go well beyond the informational/navigational/transactional/commercial buckets most SEO teams still rely on: Short fact, Bool (yes/no), Definition, Instruction, Reason, Comparison, Consequence, and Question.
The Keyword Prioritization Matrix: Building Your SEO Roadmap With Search Intent, Volume, and Business Impact
Google's quality rater guidelines define eight granular search intent classifications that go well beyond the informational/navigational/transactional/commercial buckets most SEO teams still rely on: Short fact, Bool (yes/no), Definition, Instruction, Reason, Comparison, Consequence, and Question. Each classification signals a fundamentally different user expectation for the page they click. And yet, the typical keyword prioritization process at most marketing teams I've worked with follows the same routine: export a list from your favorite tool, sort by monthly search volume, and hand the top 50 to the content team. That process produced some of the worst-performing content I've ever managed. The path from that failure to a working keyword prioritization framework took about four distinct phases, and the sequence matters because each phase exposed a flaw that the previous approach couldn't see.
The Volume-First Era and Its Ceiling
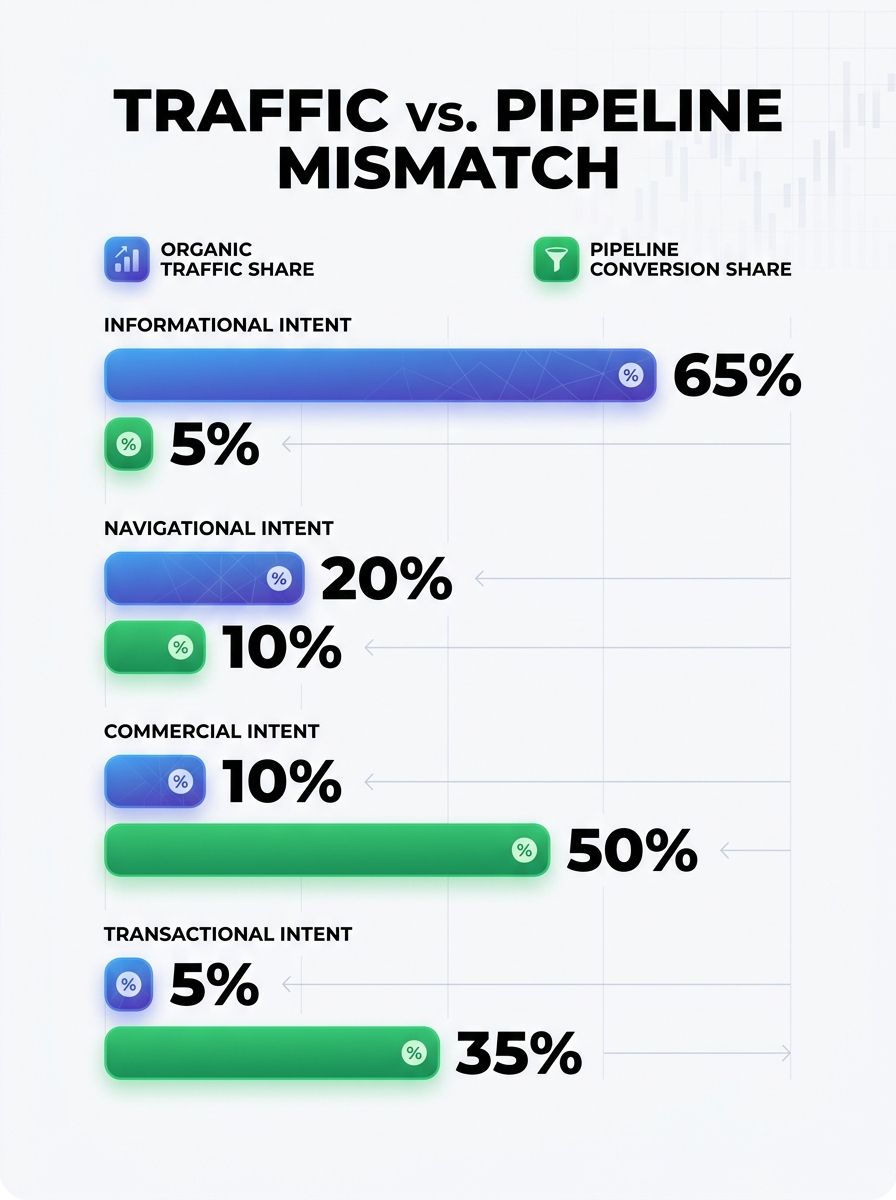
The starting point was a client engagement where we inherited a keyword list of 347 terms, all pre-sorted by estimated monthly search volume. The content team had been publishing two articles per week targeting the highest-volume terms they hadn't covered yet. Traffic was climbing. Leads were flat. The disconnect was glaring in the CRM: pages ranking on page one for 8,000-search-volume terms were generating fewer qualified leads per month than a single product comparison page ranking for a 320-search-volume term.
When I pulled the conversion data and mapped it against keyword targets, a pattern emerged. High-volume informational queries ("what is X," "how does Y work") drove 73% of organic sessions but only 11% of pipeline-attributed conversions. The pages targeting lower-volume terms with transactional or comparison intent were doing almost all the revenue work.
This wasn't surprising in retrospect. But the keyword selection process had no mechanism to account for it. Volume was the only axis. If you've ever tried to adapt your content strategy to evolving search behavior, you've probably hit the same wall: raw volume tells you what people search for, but reveals nothing about what they'll do after they land on your page.
When Intent Data Entered the Spreadsheet
The fix started with adding a second column to the prioritization spreadsheet: search intent classification. Instead of treating all 347 keywords as equivalent opportunities differing only in volume, we categorized every term by what the searcher actually wanted to accomplish.
We used a modified version of Google's eight-classification system, as documented by The Digital Ring, grouping keywords into categories like Definition (the searcher wants to understand a concept), Comparison (the searcher is evaluating options), Instruction (the searcher needs steps to complete a task), and Consequence (the searcher wants to know what happens if they take or avoid an action). Transactional queries, where the searcher is ready to act, got flagged separately.
This immediately reshuffled the priority order. A keyword with 1,200 monthly searches and Comparison intent jumped above a keyword with 6,400 monthly searches and Definition intent, because our conversion data showed comparison-intent visitors converted at 4.7x the rate of definition-intent visitors for this particular client.
But intent alone still left a gap. A high-intent keyword that has nothing to do with your product is useless. We needed a third axis.
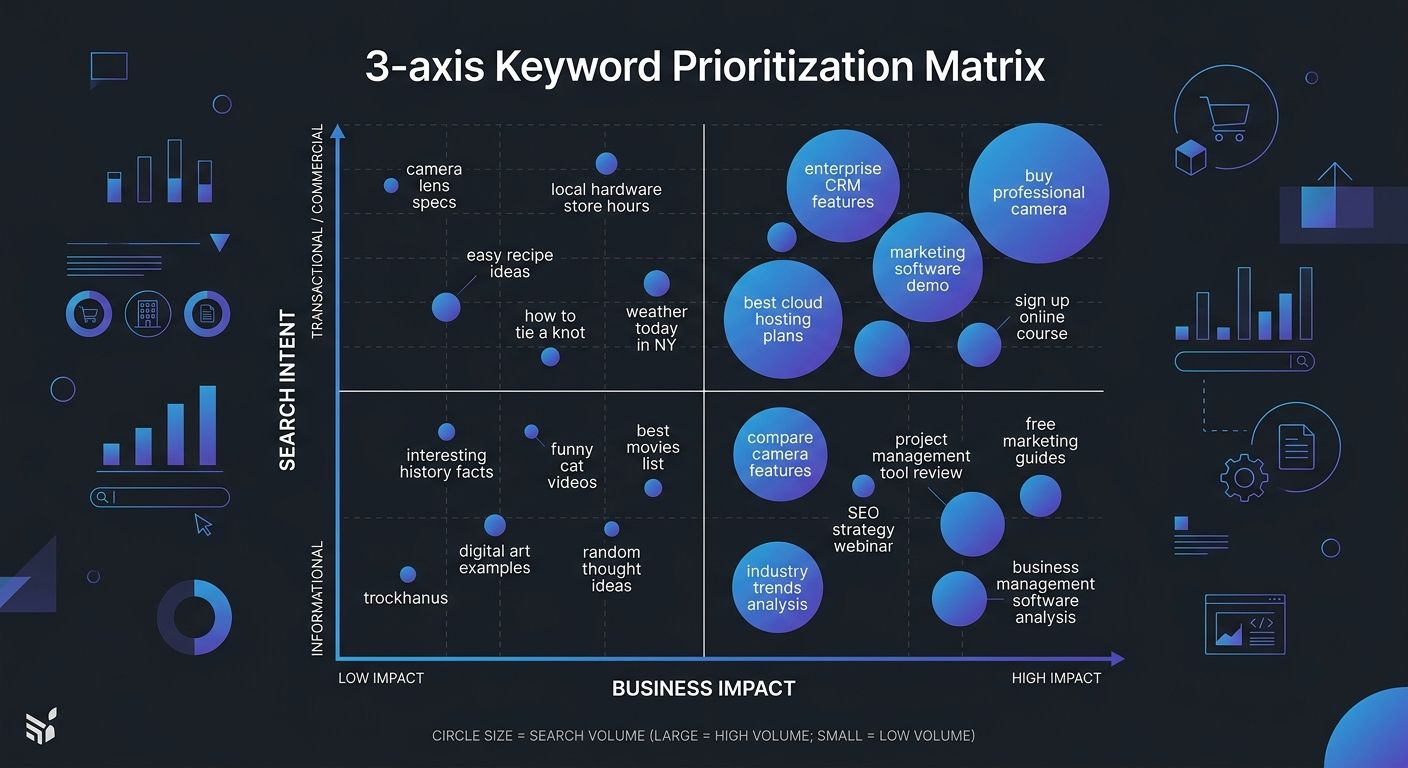
Mapping Business Impact as the Third Dimension
This was the phase where the matrix took shape. We added a Business Impact score to every keyword, rated on a 1-to-10 scale based on three questions:
Does this keyword describe a problem our product directly solves? (Score 8-10 if yes, 4-7 if adjacent, 1-3 if tangential)
Would a person searching this term be a qualified buyer within our ICP? (Based on job title, company size, and use-case signals in the query itself)
Can we create a page that naturally positions our product as part of the answer? (Without forcing it)
With three axes in place, the scoring formula became: (Intent Score × 0.4) + (Business Impact × 0.4) + (Volume Score × 0.2). The weights reflected what our pipeline data had already proven. Volume matters, but it's the least reliable predictor of revenue outcomes.
A straightforward spreadsheet turned out to be the most practical format for this matrix, which aligns with what most experienced SEO practitioners recommend for SEO roadmap planning. Fancy tools are nice, but a spreadsheet you actually update beats a dashboard nobody checks.
Where Keyword Difficulty Assessment Fits
You'll notice keyword difficulty isn't one of the three primary axes. That's deliberate. Keyword difficulty assessment is a filter, not a scoring dimension. After scoring all keywords on intent, business impact, and volume, we applied difficulty as a feasibility check. Keywords scoring above our threshold on the three-axis model but showing difficulty scores beyond our realistic ranking capacity got moved to a "build authority first" backlog rather than eliminated entirely.
One nuance worth noting: SEMrush's personal difficulty metric, which factors in your specific site's topical authority, proved far more useful than generic KD scores that only measure the competitive landscape in the abstract. Several practitioners on r/SEO have validated this observation, noting that personal difficulty scores helped them avoid both overestimating and underestimating their ranking chances.
If your technical SEO foundation is solid but you're still struggling with rank outcomes, the issue often lives in the disconnect between passing audits and actual ranking performance, not in keyword difficulty alone.
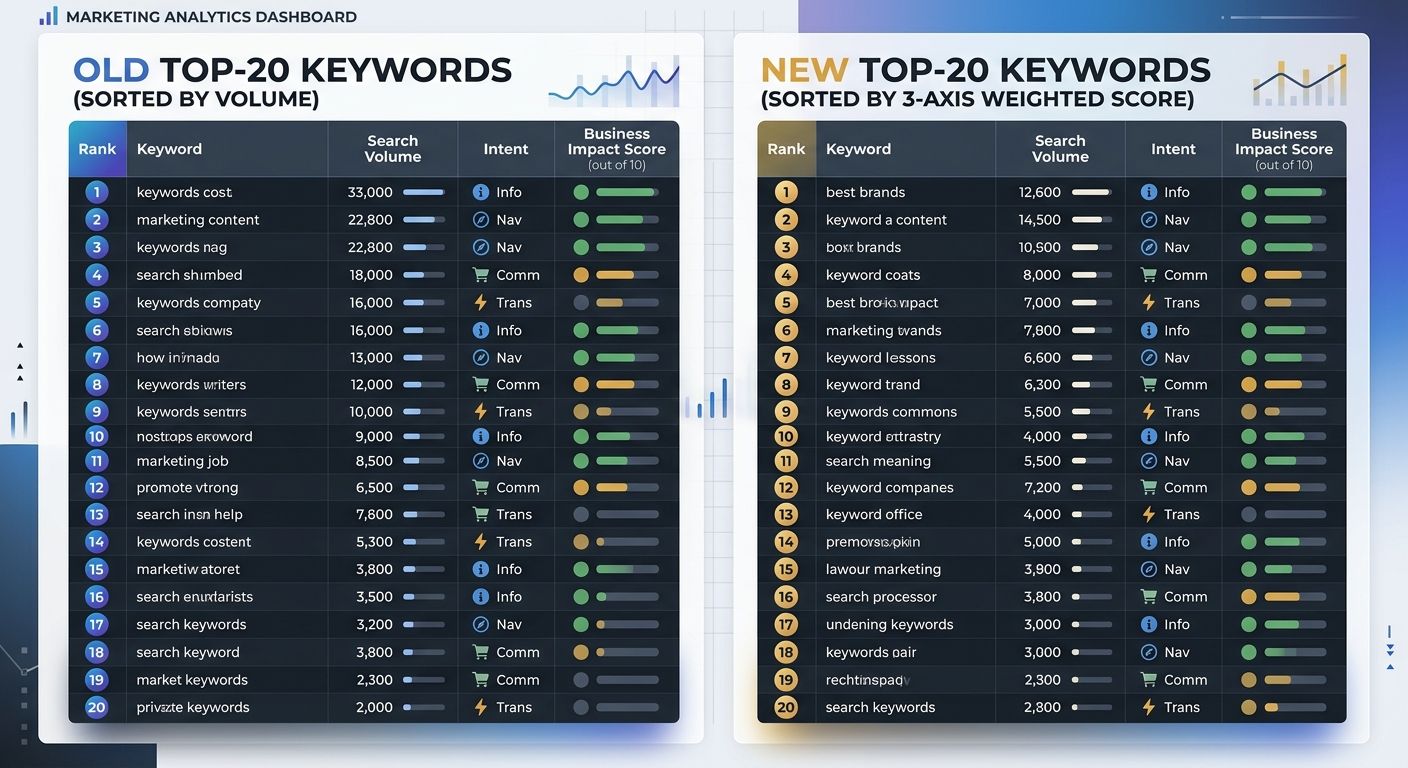
Running the Weighted Score Across a Real Keyword Set
We re-scored the original 347 keywords plus an additional 89 terms from a competitor gap analysis. The results reorganized our content calendar dramatically.
The top 20 keywords by the old volume-only method and the top 20 by the three-axis matrix overlapped on only 4 terms. Sixteen of the matrix's top 20 had been buried in the middle of the old list because their monthly search volume sat between 400 and 2,100.
Here's what the redistribution looked like across intent categories in the new top 50:
Comparison and Consequence intent: 22 keywords (44%)
Instruction intent: 12 keywords (24%)
Definition intent: 9 keywords (18%)
Short fact and Bool intent: 7 keywords (14%)
Under the old system, Definition keywords had dominated the top 50 because they tend to carry the highest raw search volumes. The three-axis model pushed them down and elevated the comparison and consequence terms where buyer readiness was highest.
This is the core of strategic keyword selection: you're not picking the keywords with the most searches. You're picking the keywords where the overlap between user intent, your product's relevance, and achievable ranking positions creates the highest expected conversion value.
For teams working across departments on content production, aligning on this kind of scoring model early prevents the "why did we write that?" conversations later. Getting cross-functional SEO workflows right depends on having a shared prioritization language everyone trusts.
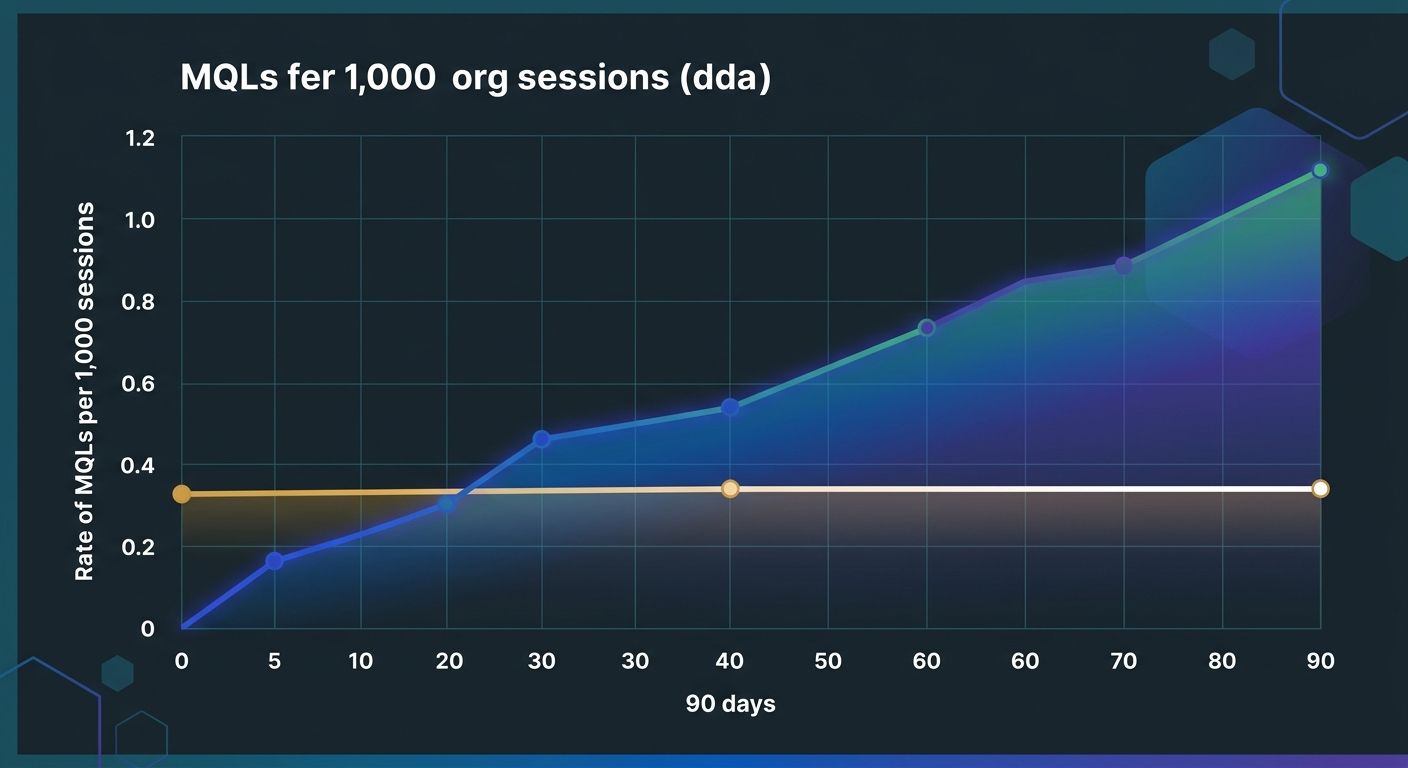
What the Pipeline Data Showed After 90 Days
We tracked every content piece published under the new prioritization model against the same conversion metrics we'd used to diagnose the original problem. The comparison period ran from the initial content launches through 90 days of indexation and ranking stabilization.
Pages targeting matrix-prioritized keywords generated 3.2x more marketing-qualified leads per 1,000 organic sessions than pages published under the old volume-first model during a comparable window. The average cost-per-lead from organic content dropped by 41%, because we were producing fewer total pages but each page attracted visitors with higher purchase intent.
Two specific findings stood out:
Comparison-intent content outperformed everything else on pipeline velocity. Pages structured around "[Product A] vs. [Product B]" or "Best [category] for [use case]" queries moved leads from first touch to sales conversation 2.8x faster than informational content. These visitors had already defined their problem and were actively evaluating solutions.
Consequence-intent keywords were the sleeper category. Terms like "what happens if you don't [implement X]" or "risks of [not doing Y]" attracted visitors with high urgency and strong buying signals. These keywords rarely appeared in traditional volume-based prioritization because their search volumes tend to be low, but their conversion rates were consistently above average.
The data also highlighted something I'd underestimated: pages optimized for on-page SEO signals like titles and meta descriptions specifically tuned to match the intent classification performed noticeably better than pages where we'd written generic meta tags. A comparison-intent page with a meta title structured as "X vs. Y: Which Does [Specific Thing] Better" earned a 23% higher CTR from search results than the same page with a generic title.
Where the Data Looks Today
The three-axis matrix has been running as our default keyword prioritization framework for long enough now to draw some durable conclusions.
The weighting formula has shifted slightly. We've moved Business Impact up to 0.45 and Volume down to 0.15, because the pipeline data consistently shows that even modest-volume keywords with strong business alignment produce outsized returns. Intent stays at 0.4.
One significant adaptation: AI-generated search results have compressed click-through rates on informational queries, which means the volume numbers your keyword tool reports for Definition and Short-fact intent terms increasingly overstate the actual traffic you'll receive. We've started applying a CTR discount factor to informational keywords based on whether the SERP shows an AI Overview. If it does, we cut the effective volume estimate by 30-45% before scoring. Understanding how AI search is reshaping traffic patterns feeds directly into more accurate prioritization.
The impact-urgency matrix framework from Miro influenced how we handle the temporal dimension of prioritization. Keywords don't just have a static score; they have a time horizon. Some high-scoring keywords require foundational content or backlink authority you don't have yet. Those go into a 90-day or 180-day column. Others can be acted on this sprint. Separating "what to target" from "when to target it" made the matrix operationally useful instead of just analytically interesting.
The framework continues to evolve, and it should. Any static keyword model degrades as search behavior shifts and your own domain authority changes. The version we run today scores and re-scores quarterly, pulling fresh SERP data, updated difficulty metrics, and new conversion rates into the same spreadsheet where the original 347 keywords lived. The spreadsheet has grown. The logic has tightened. And the pipeline keeps validating the core premise: when you prioritize by intent and business alignment instead of raw volume, your content produces revenue, not just pageviews.

Alex Chen
Alex Chen is a digital marketing strategist with over 8 years of experience helping enterprise brands and agencies scale their online presence through data-driven campaigns. He has led marketing teams at two successful SaaS startups and specializes in conversion optimization and multi-channel attribution modeling. Alex combines technical expertise with strategic thinking to deliver actionable insights for marketing professionals looking to improve their ROI.
Explore more topics